Bridging solid FEA models to design codes through linearization
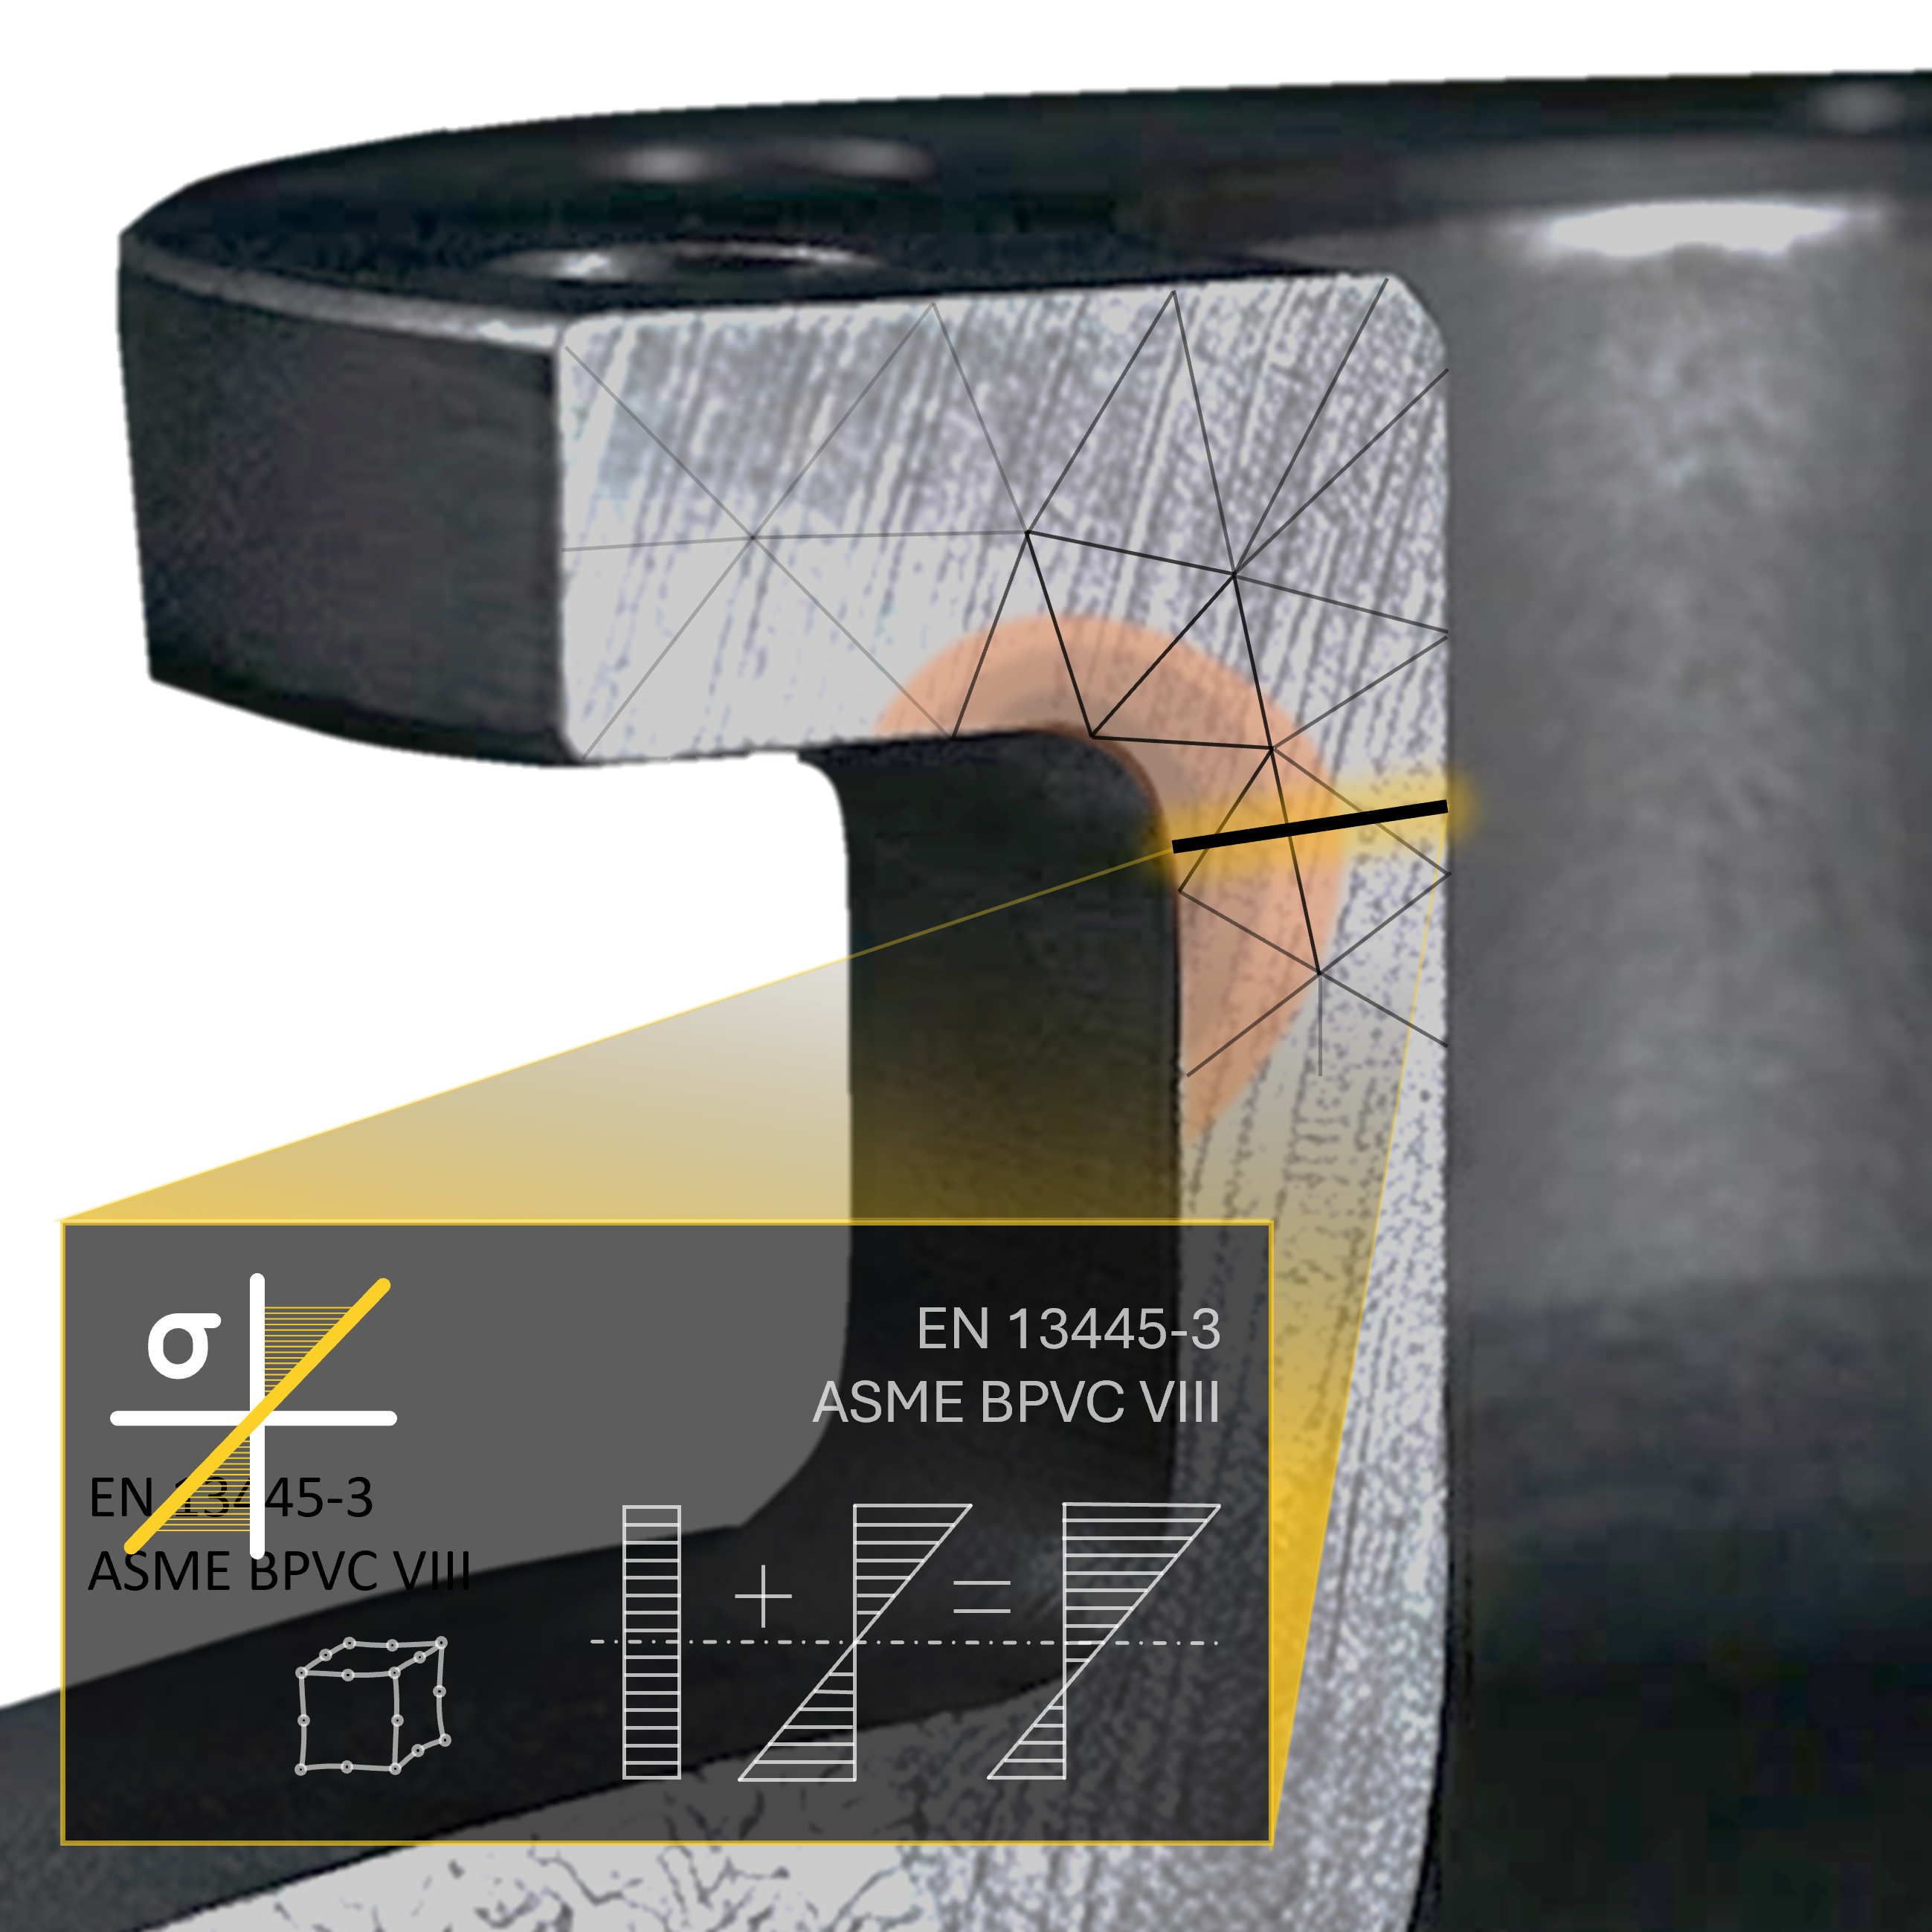
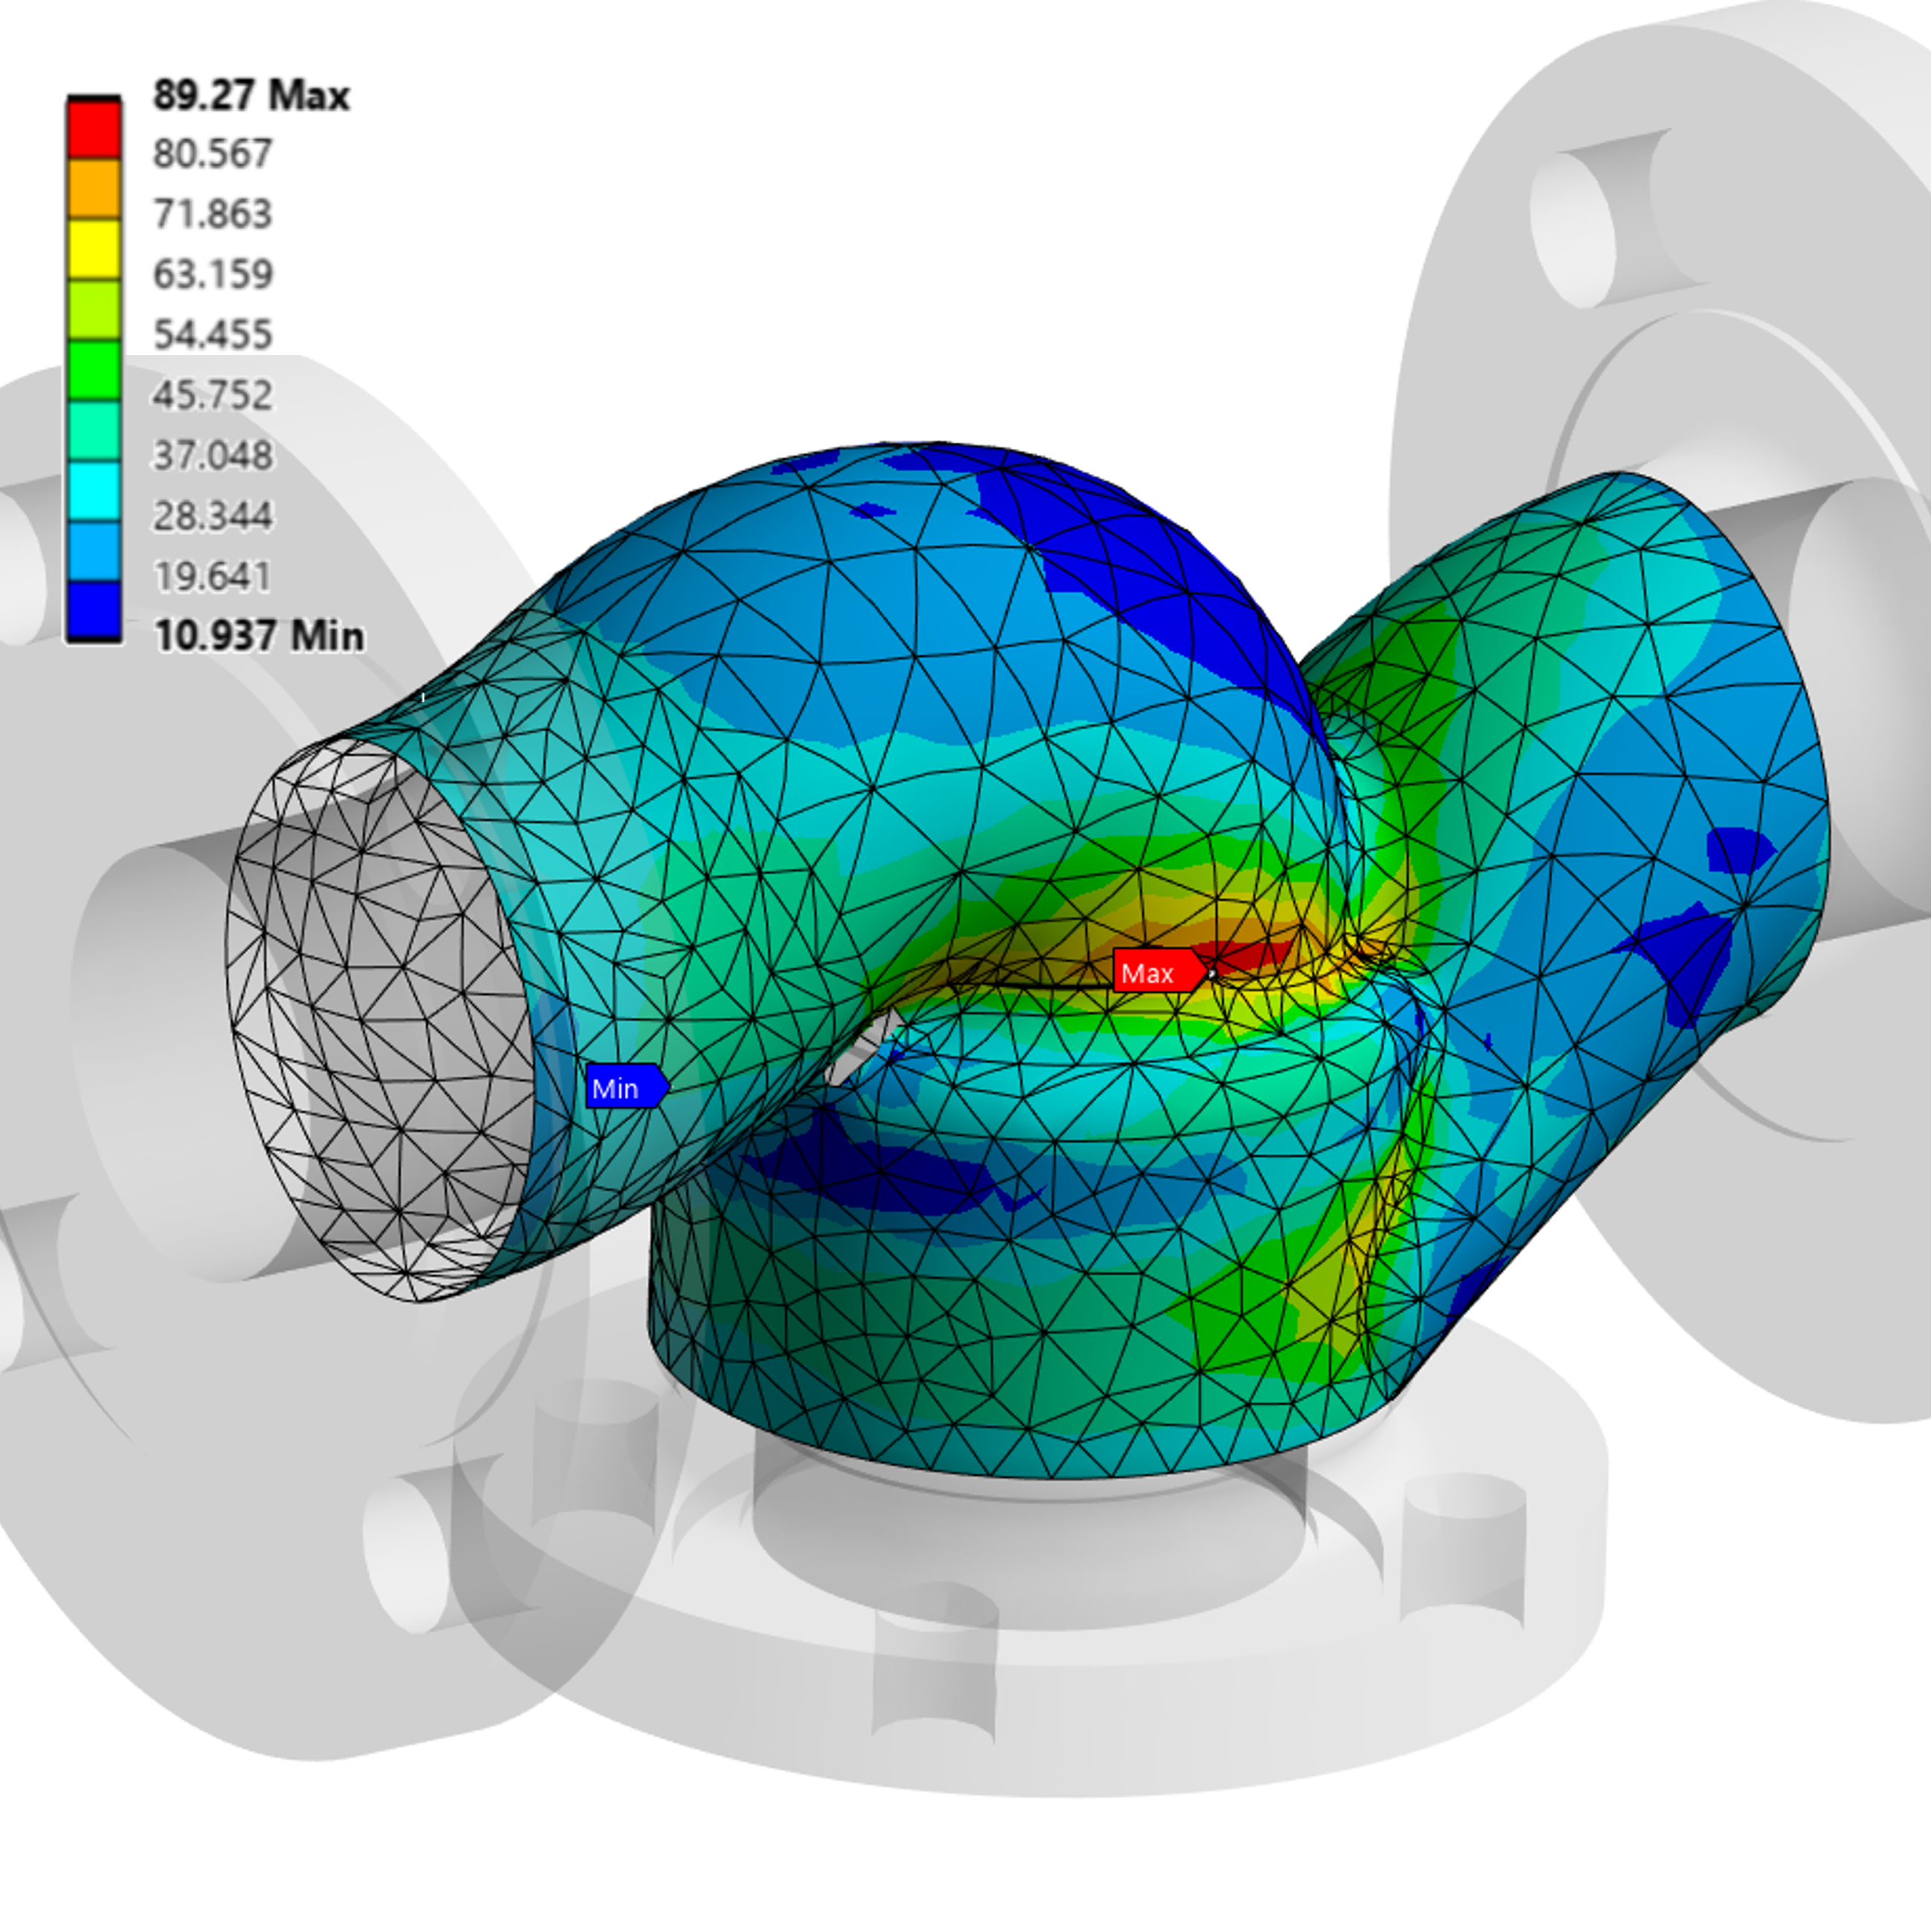
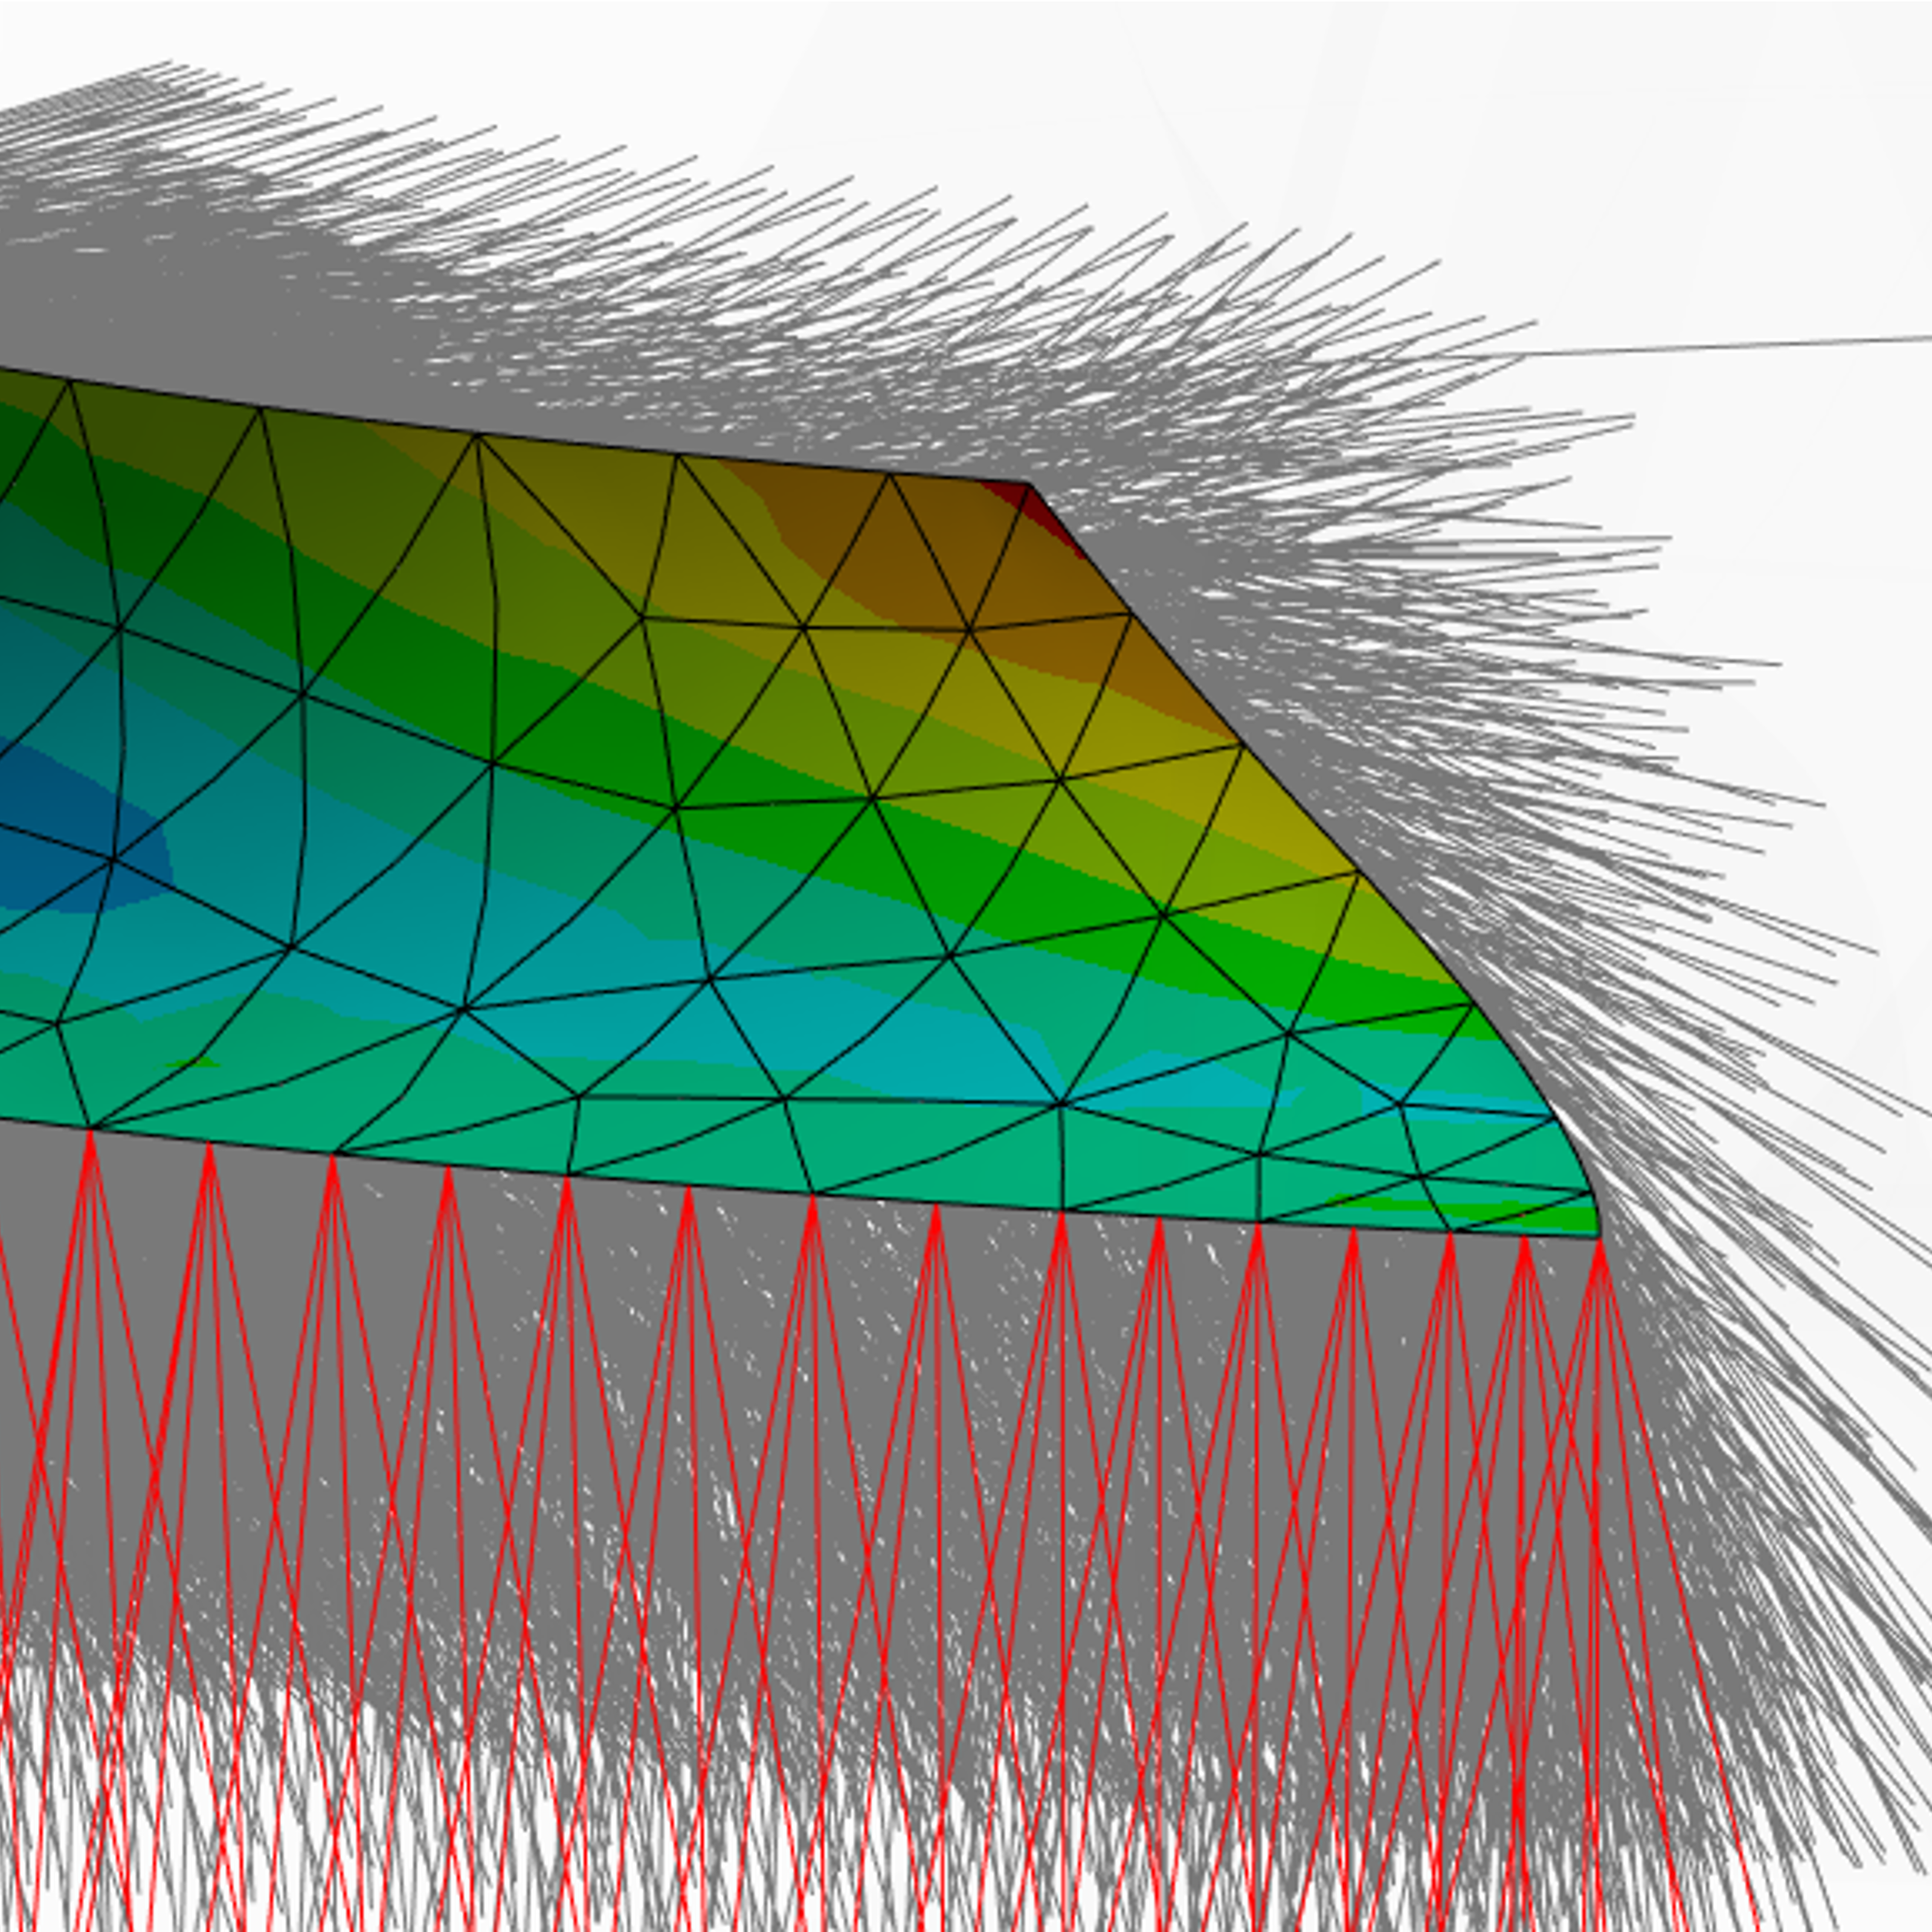

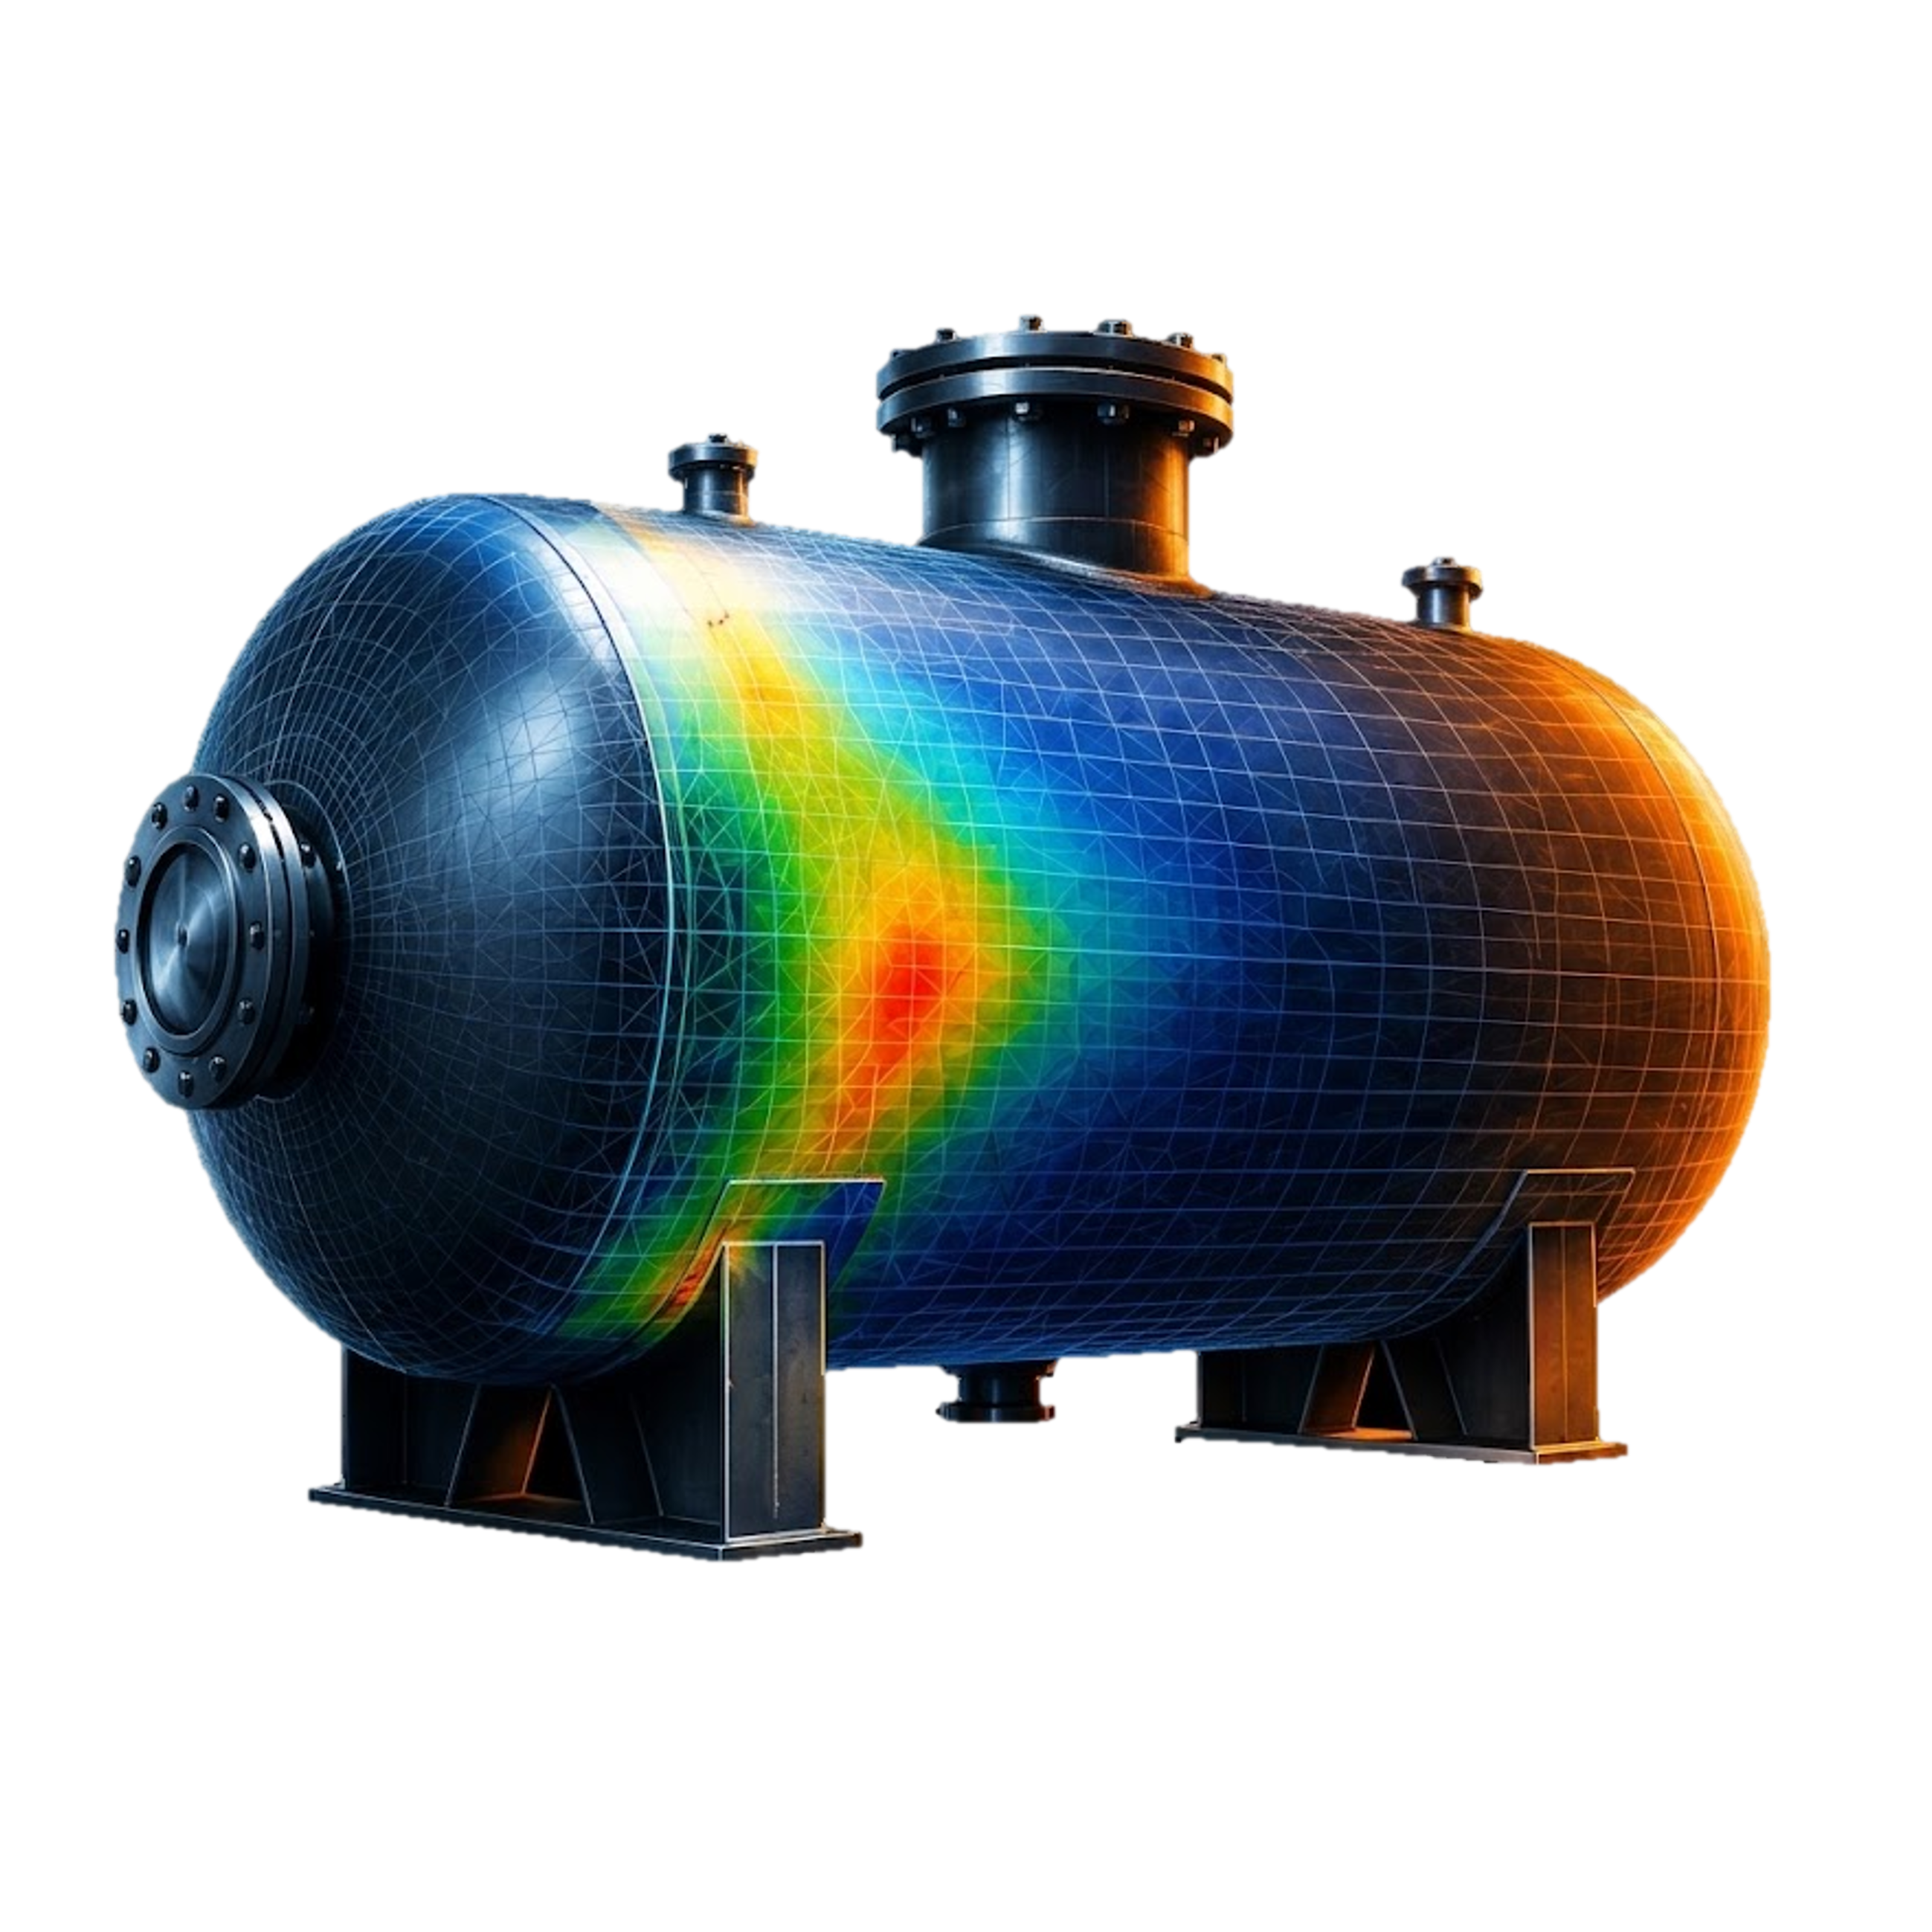
Regardless of the design code* being applied, achieving code compliance requires a correct stress linearization setup. However, the process presents several challenges:
*EN 13445-3; ASME BPVC VIII; NTD A.S.I.; AD 2000; KTA 3201.2; PD 5500; CODAP
?"The design has changed! Do I have to place all the SCLs again?"
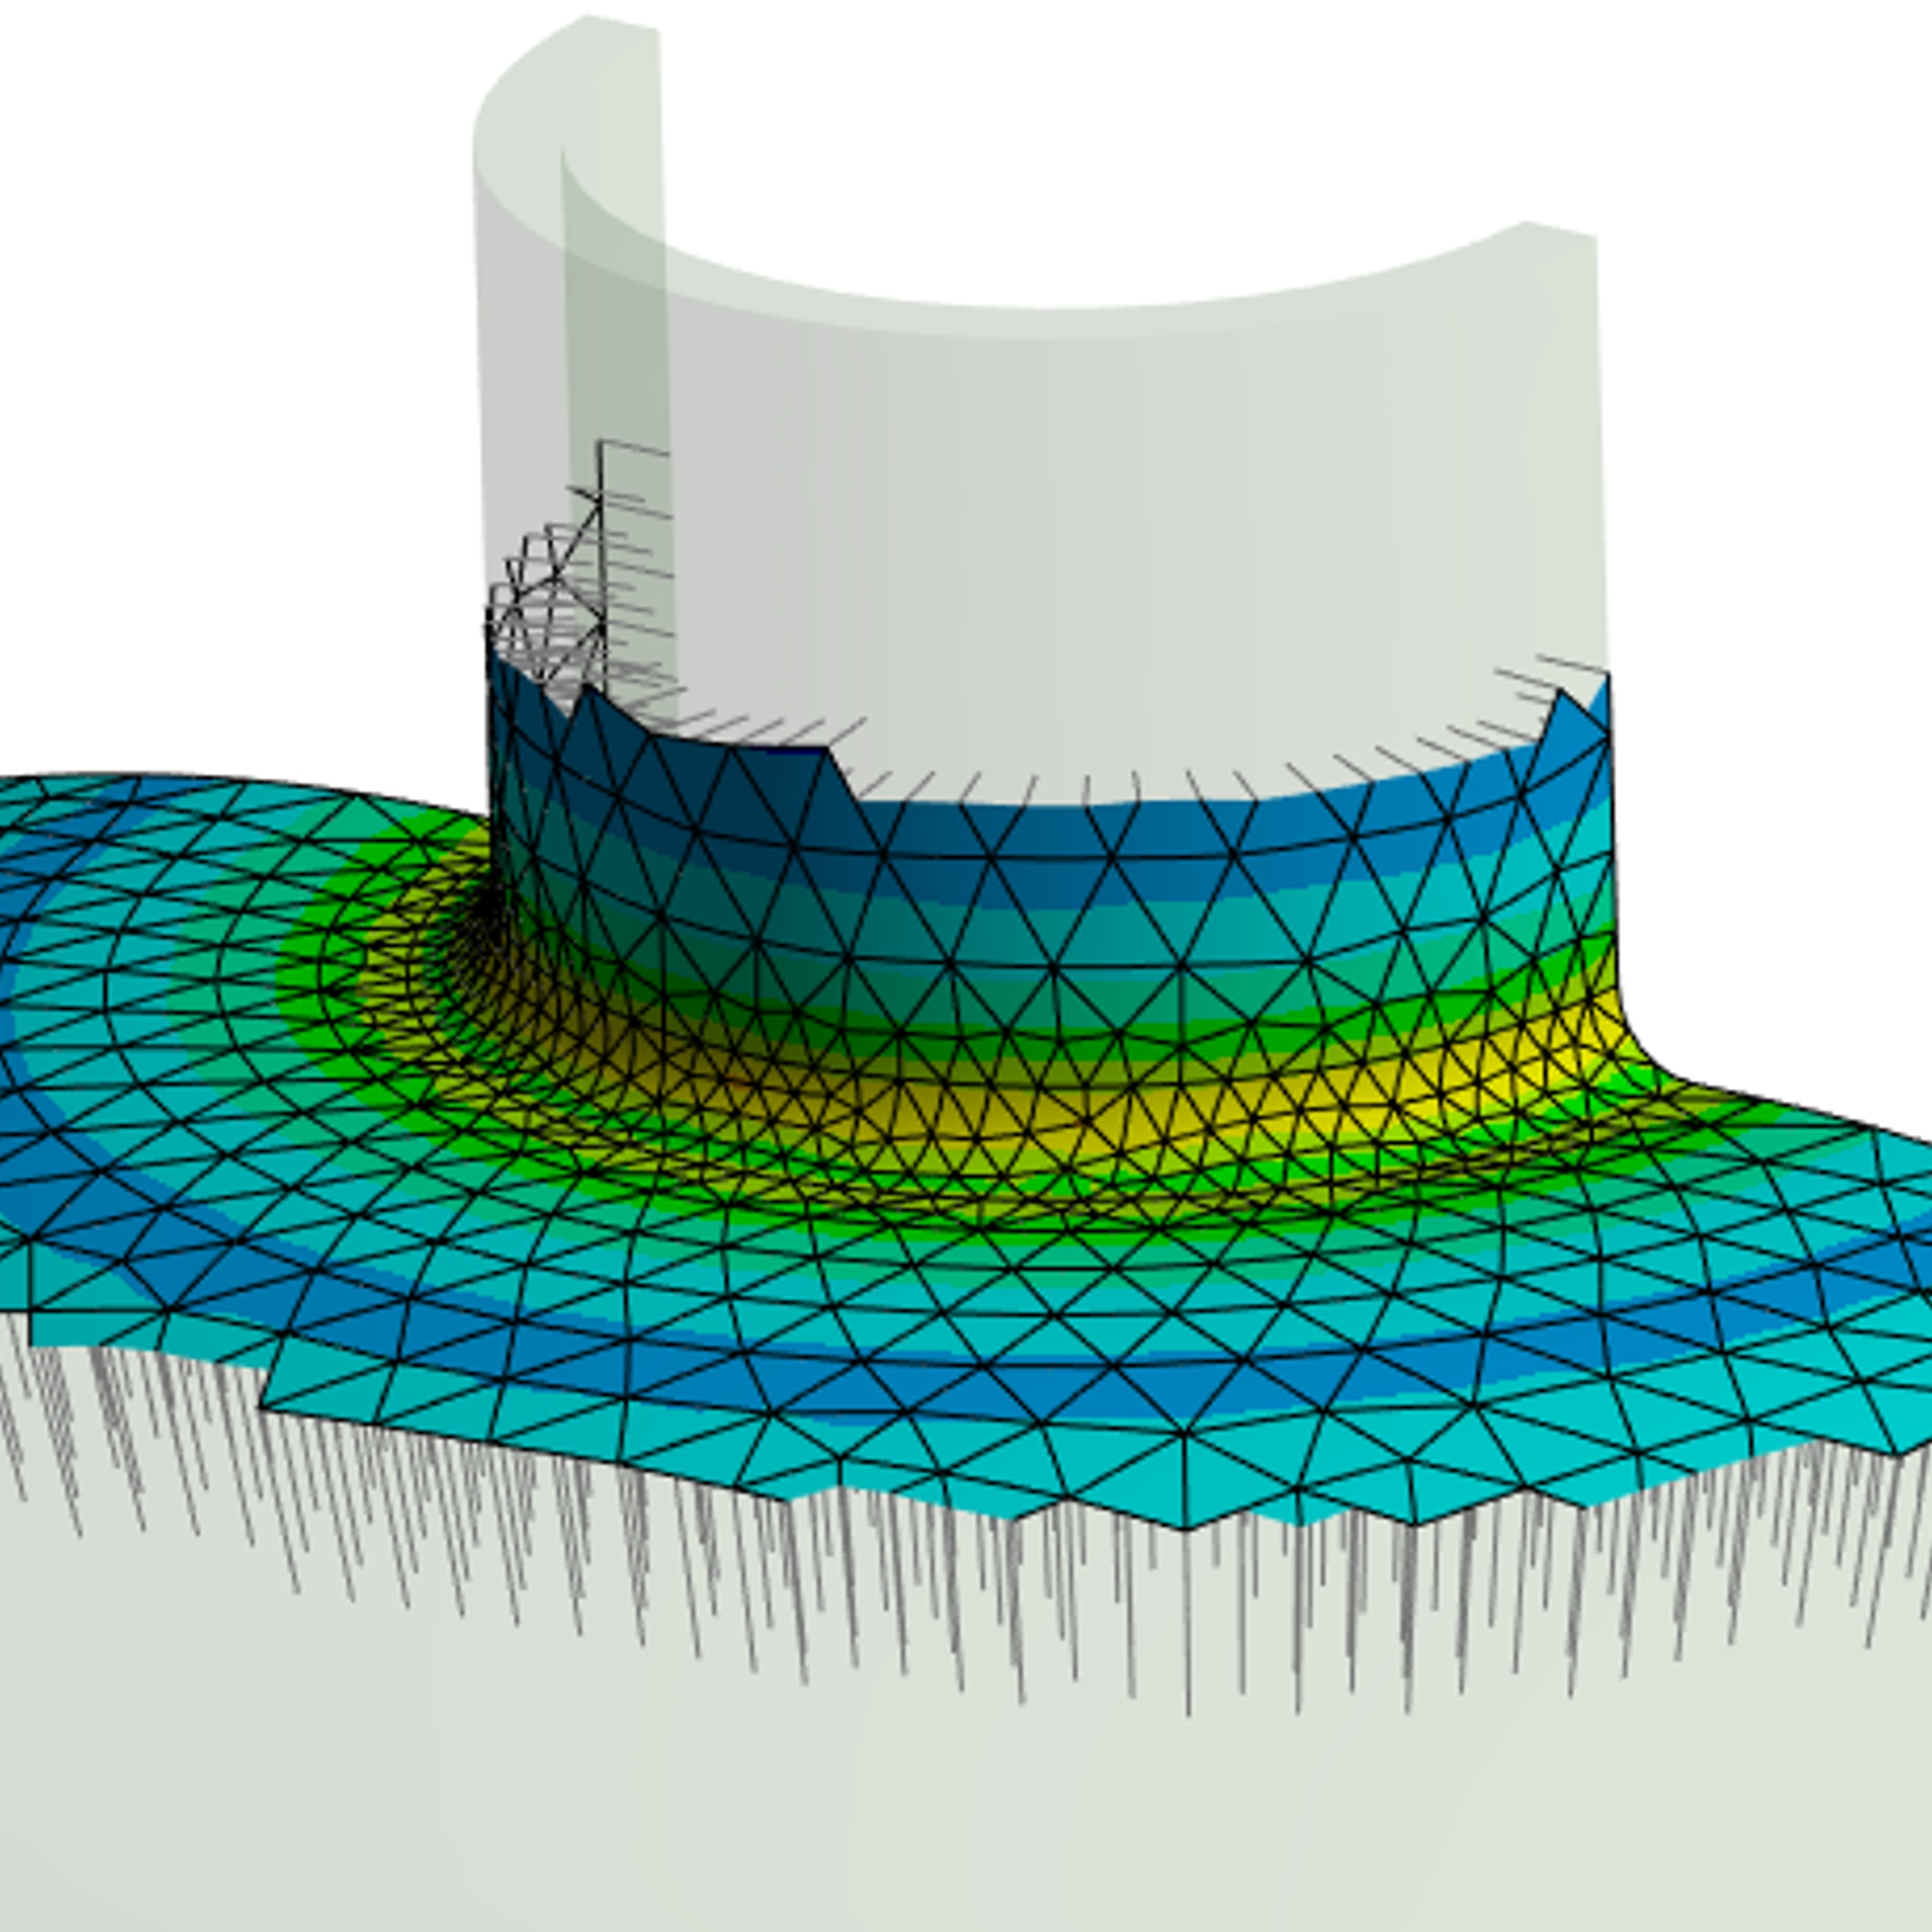
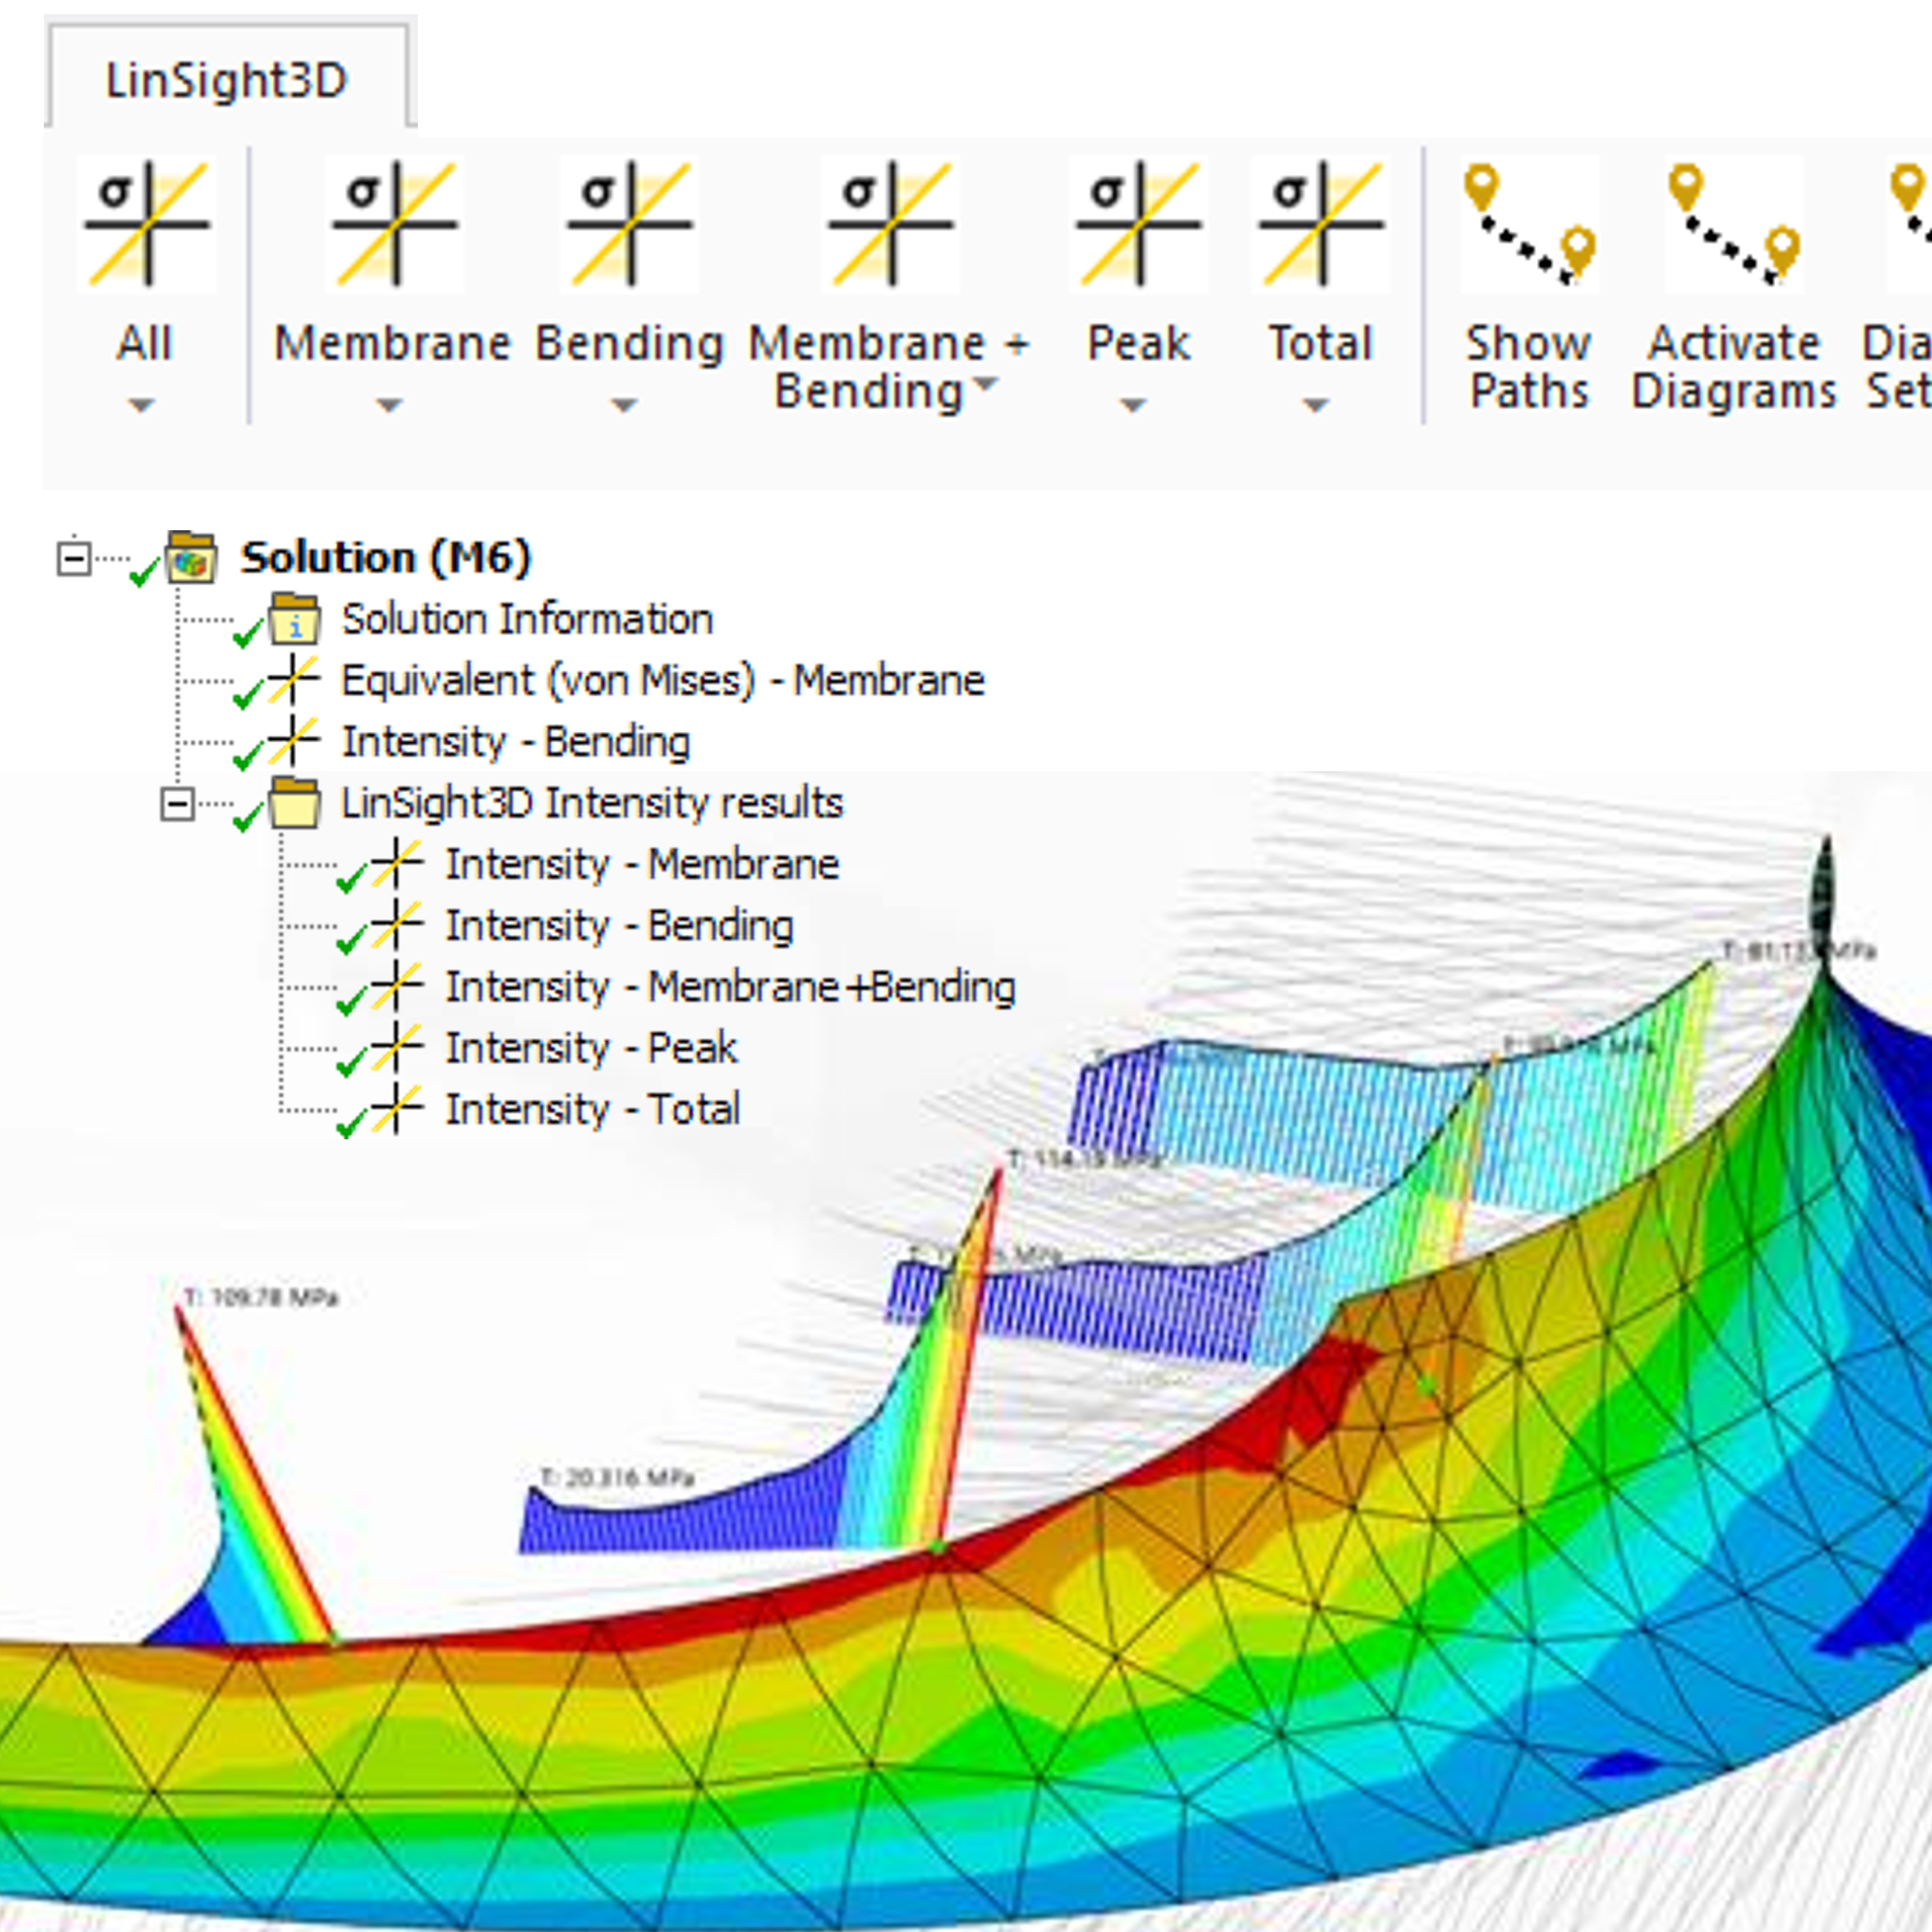
[LinSight3D] addresses these challenges inside Ansys Mechanical. Instead of placing [kw:Stress Classification Line (SCL)] one by one, it linearizes from every node of the selected surface and shows the result as a [kw:Contour Plot]. The critical location, direction and load step are read, not guessed.
LinSight3D is an Ansys Customization Toolkit (ACT) extension for Ansys Mechanical developed by SVS FEM s.r.o.
The extension is fully integrated into the standard user environment.
ACT enables developers to extend Ansys Mechanical with custom objects, so that users can access advanced functionality without leaving their established simulation workflow.
ACT can automate repetitive engineering tasks to reduce manual effort, accelerate workflows, and minimize user errors.
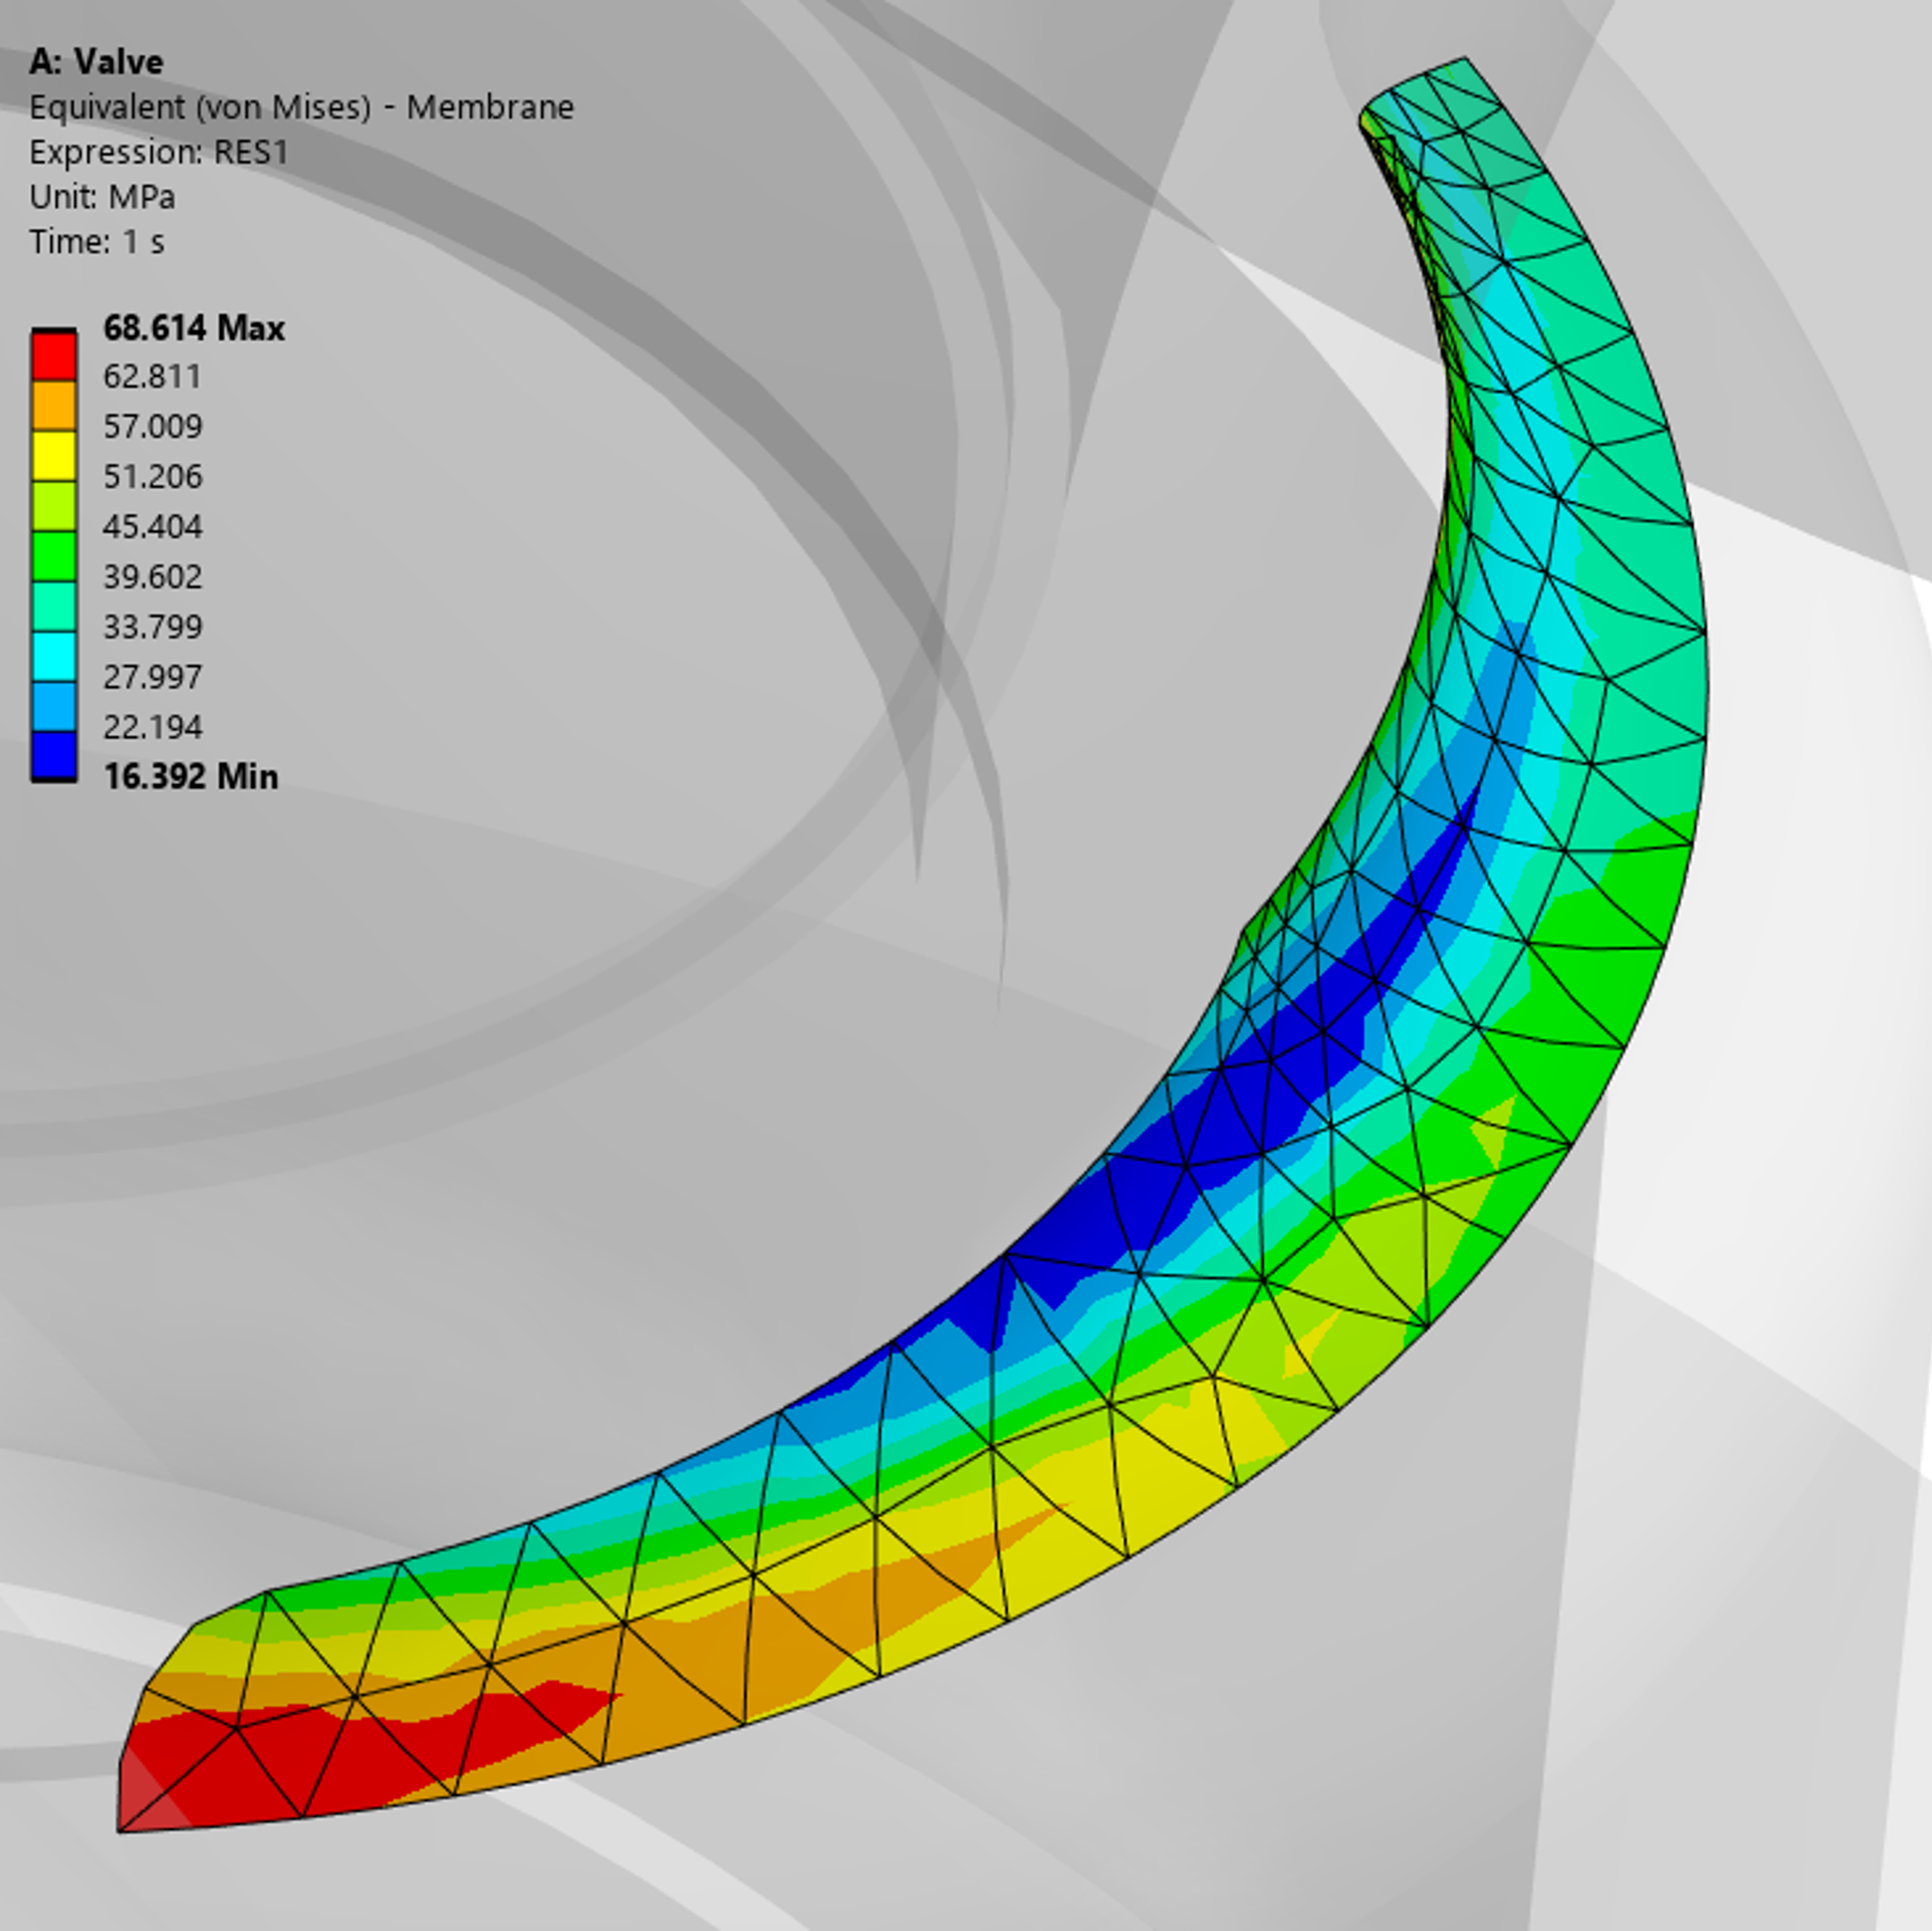
Solid finite element models provide highly detailed insight into structural behavior, but their raw stress results cannot be directly evaluated against traditional design codes.
Design codes are based on [kw:membrane] and [kw:bending] stress concepts derived from classical strength-of-materials theory rather than detailed 3D stress fields.
Stress linearization bridges this gap by transforming solid FEA results into code-relevant stress components suitable for standards-based assessment.
Our in-house algorithms automatically create an evaluation SCL from each mesh node across selected surfaces, independent of the FE mesh.
Transient and multi-step analyses are supported.
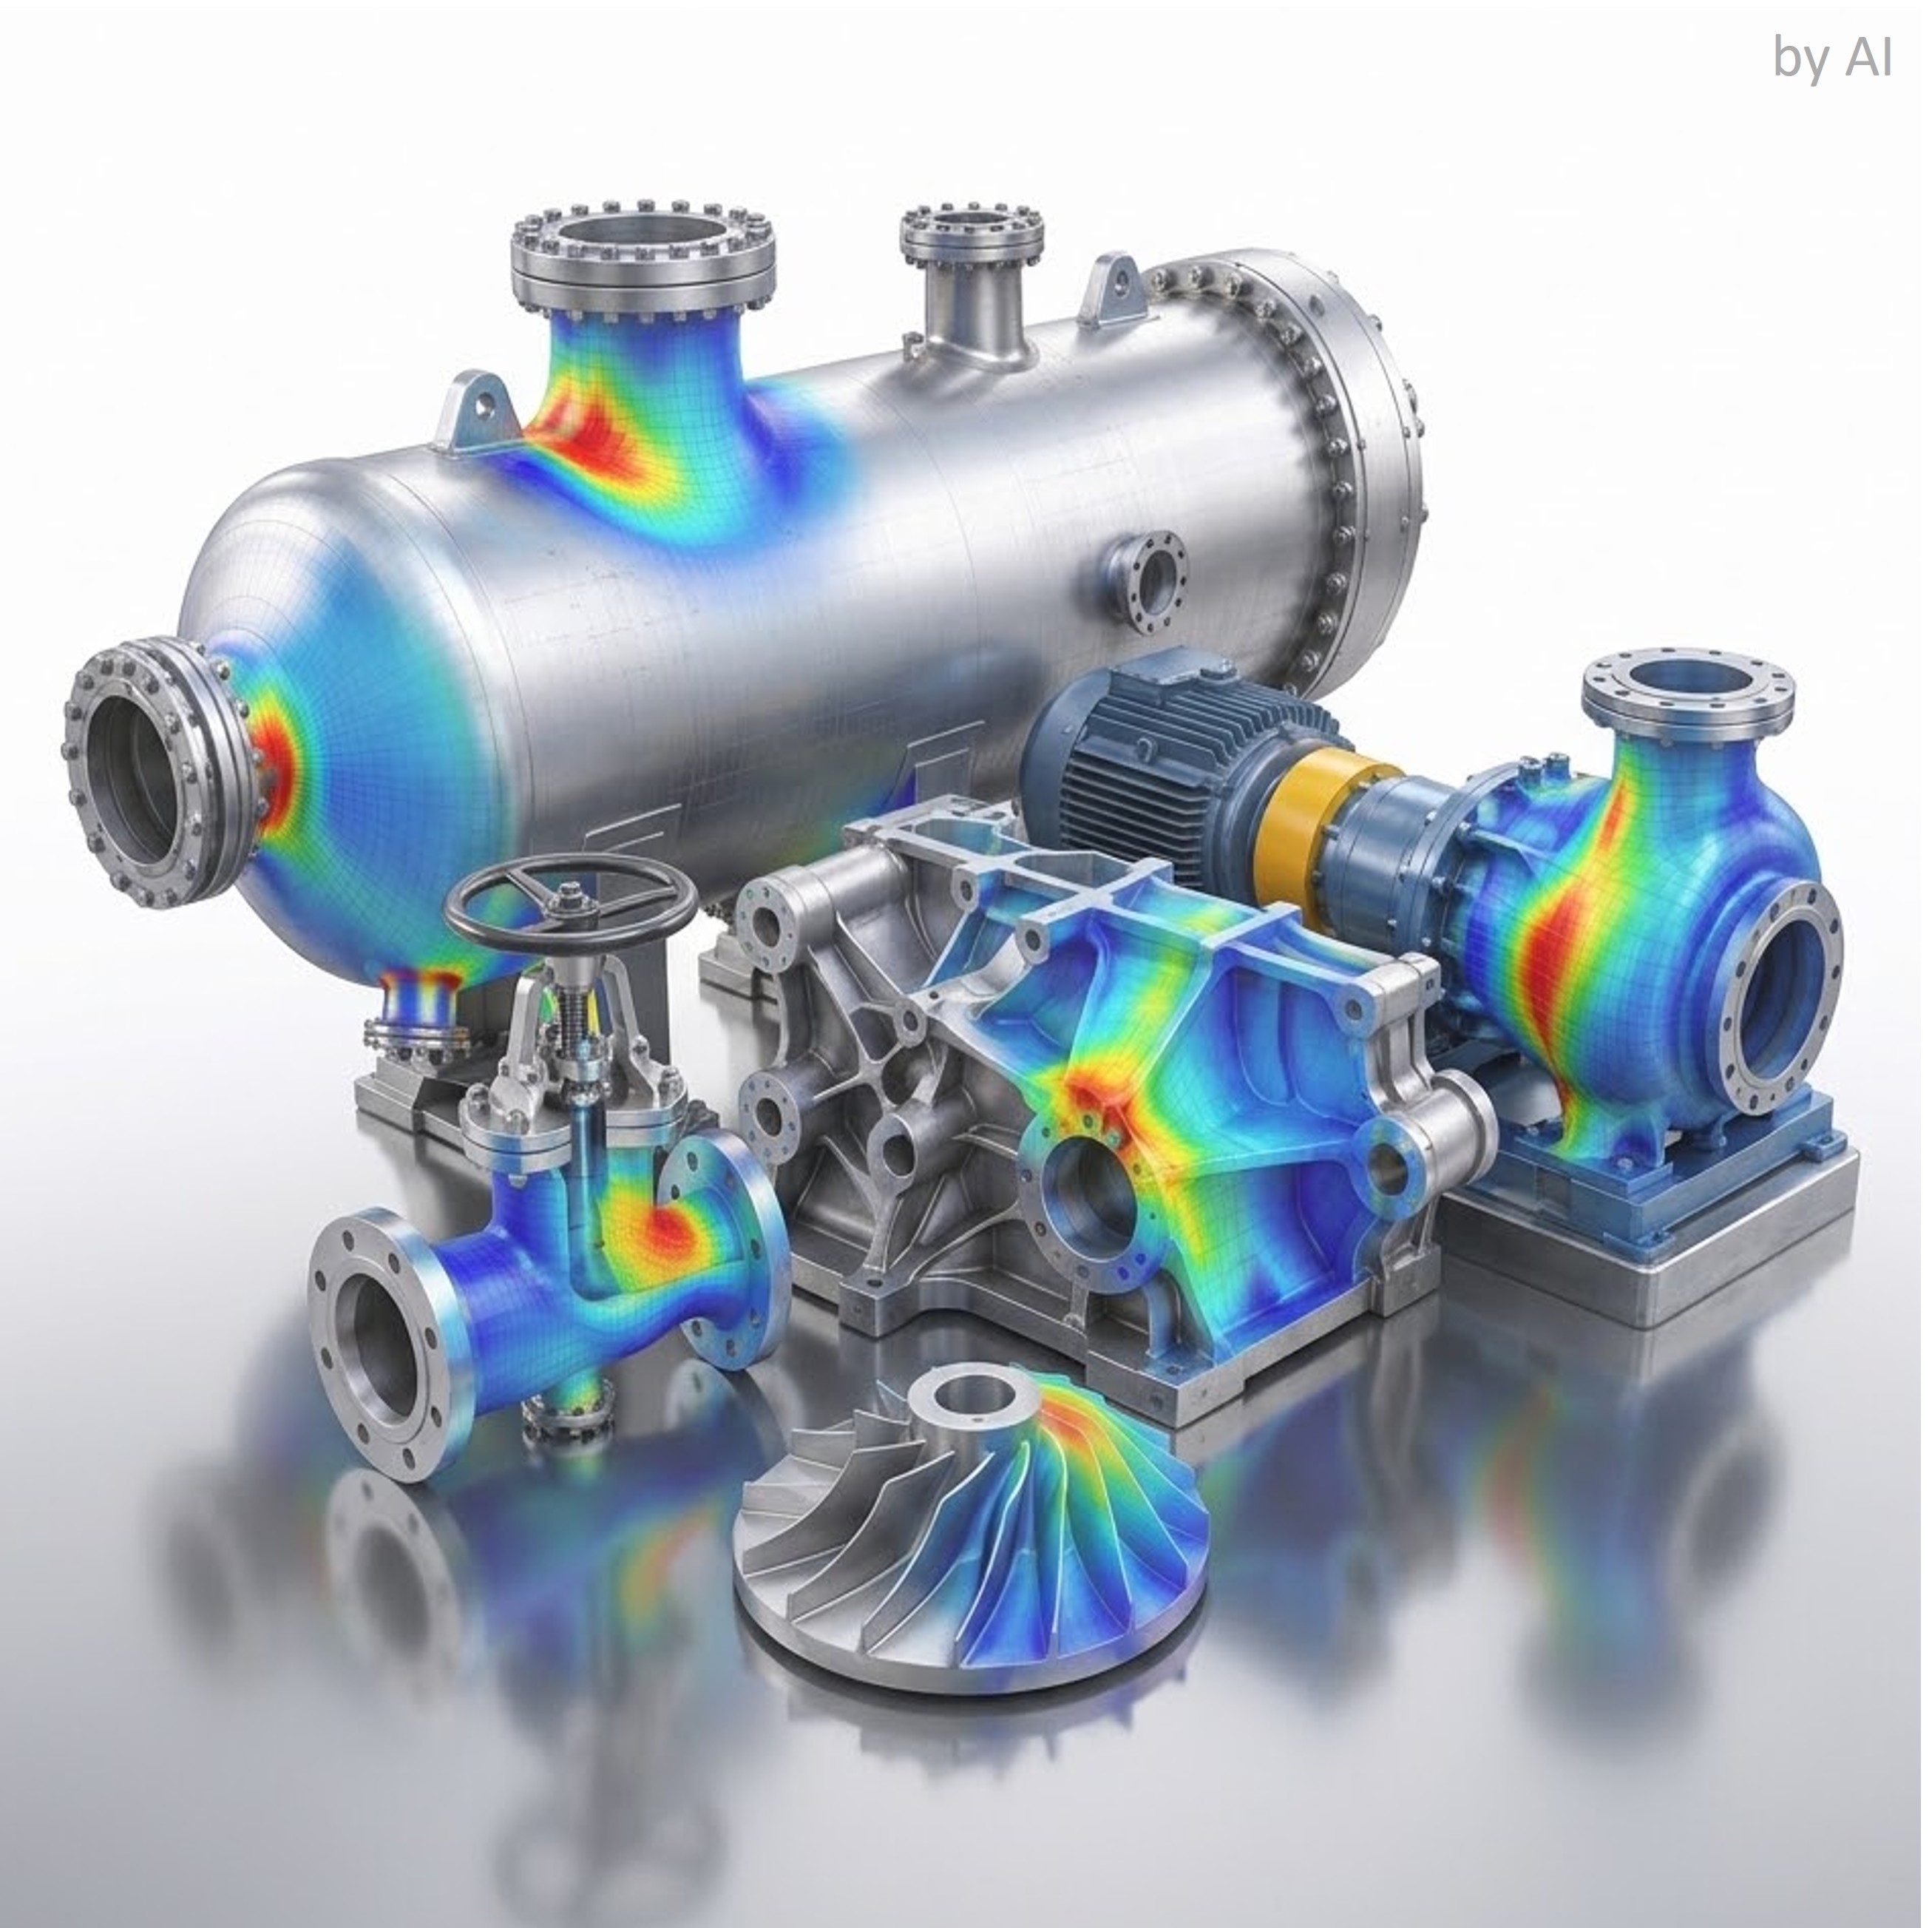
Linearized results can be viewed and analyzed across whole components using clear contour plots and interactive [kw:diagrams]. Typical applications:
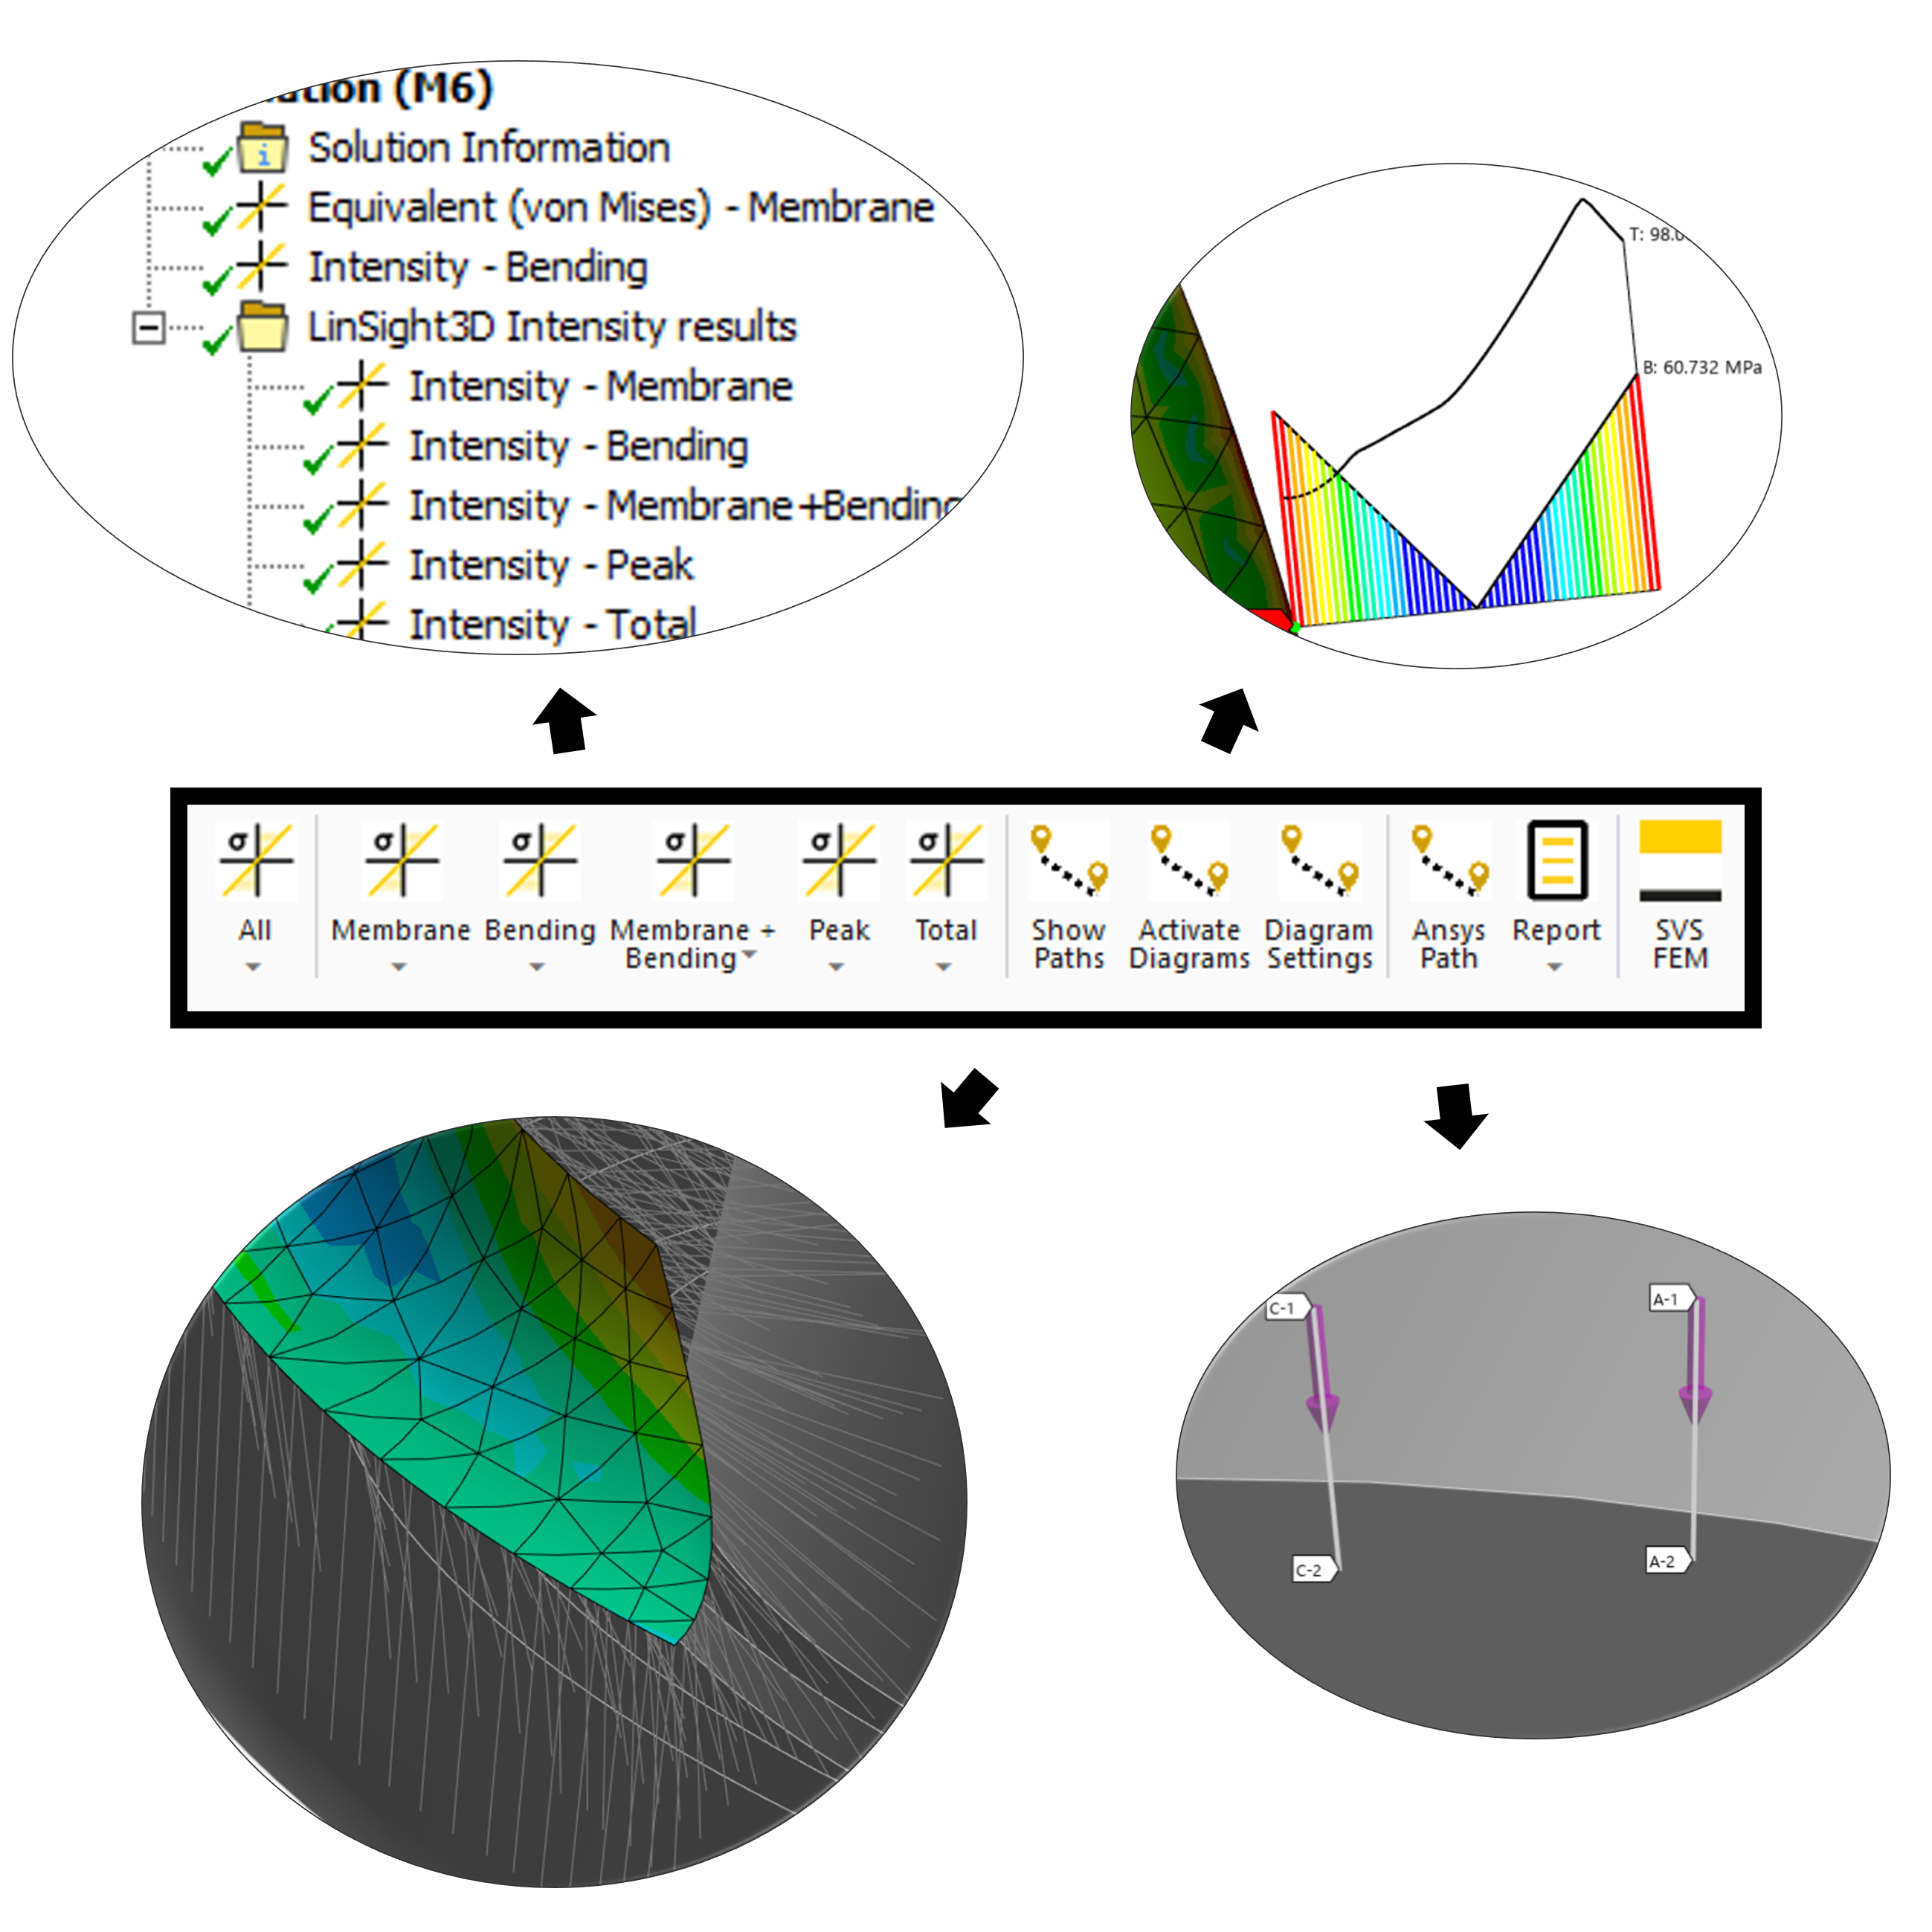
[LinSight3D] inside Ansys is a tool for Mechanical that covers the entire linearization assessment process, providing engineers with a powerful all-in-one solution for structural design and development using the methodology of stress linearization, as described in Design Codes.
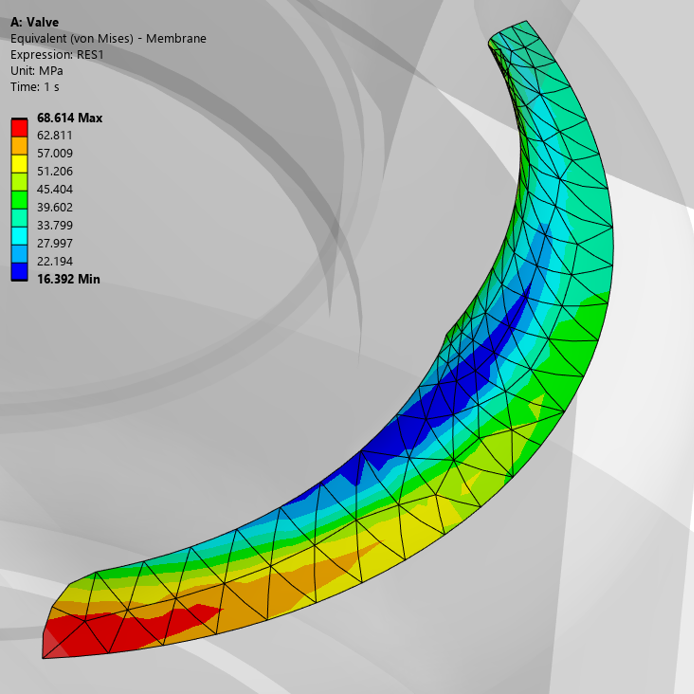
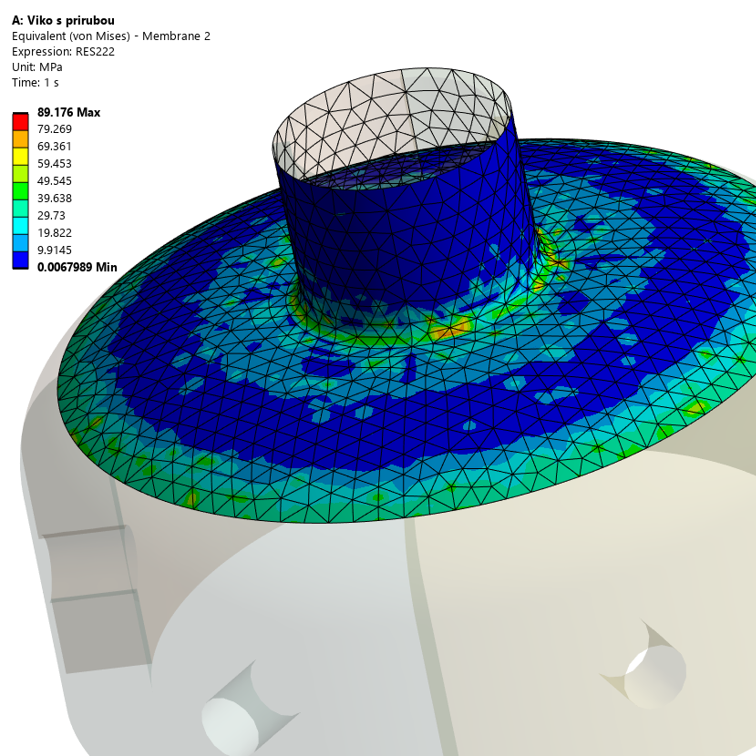
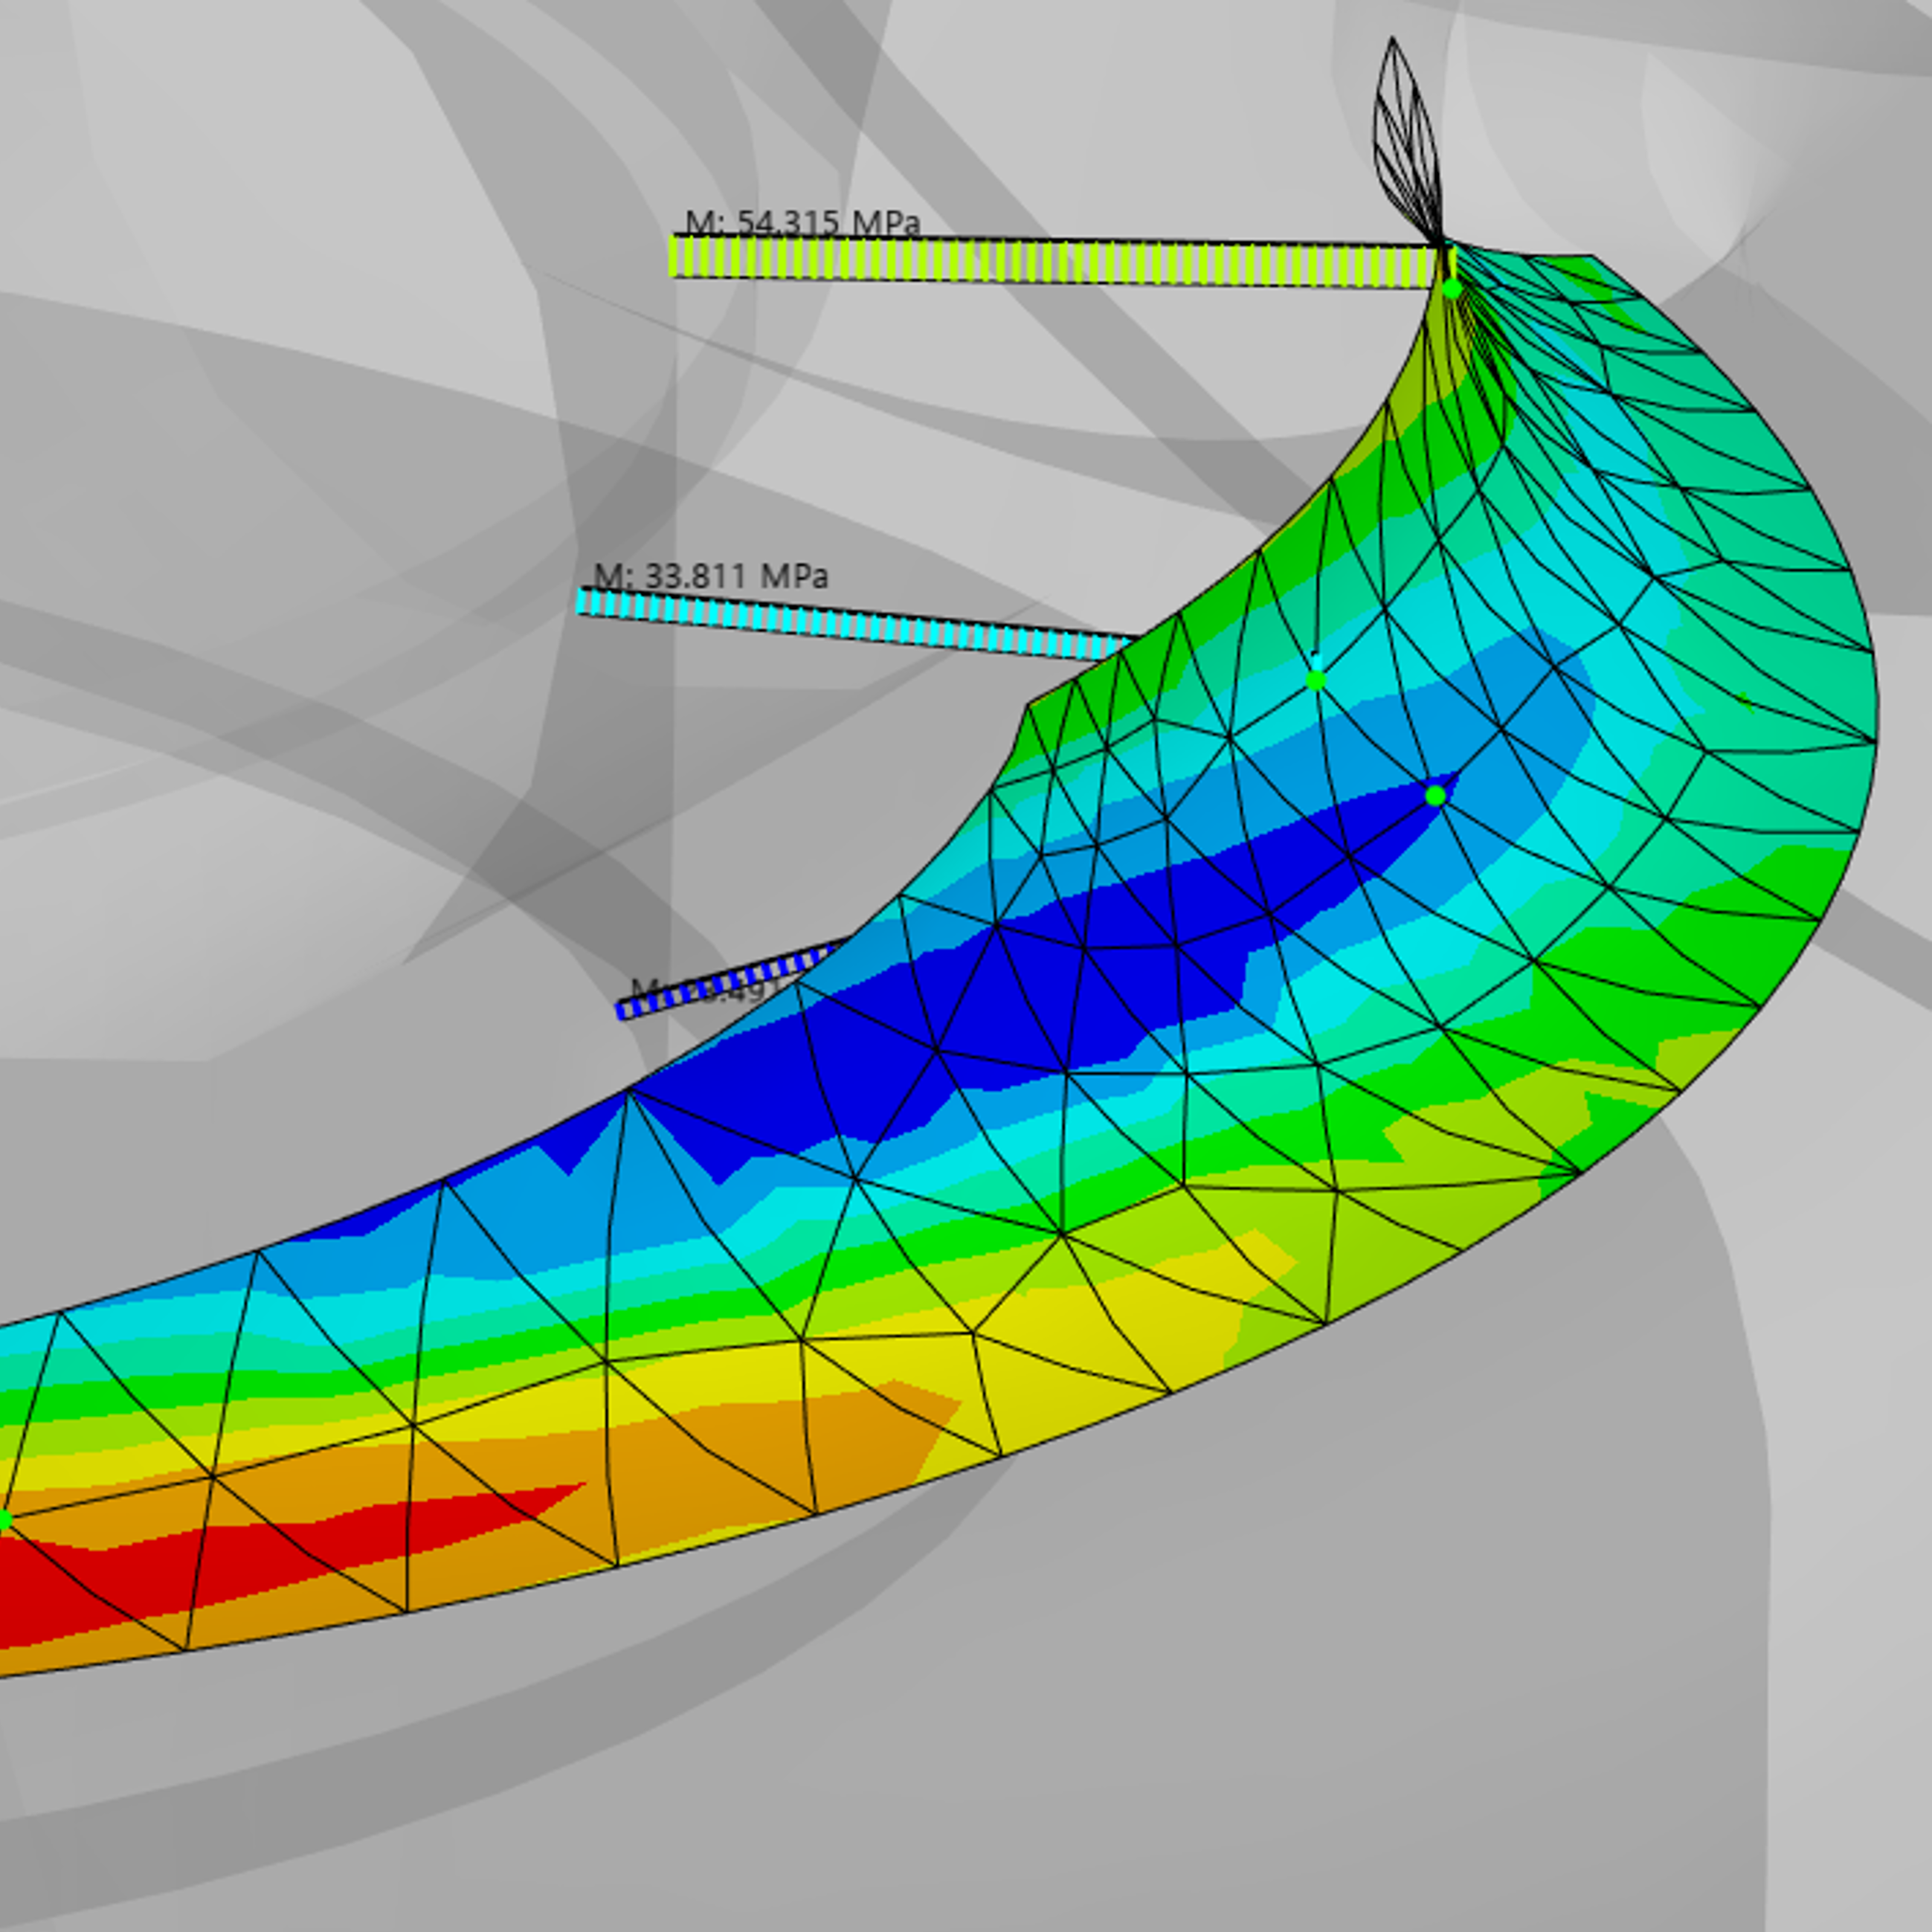
Linearized results can be displayed as contours on an arbitrary surface, divided into five components:
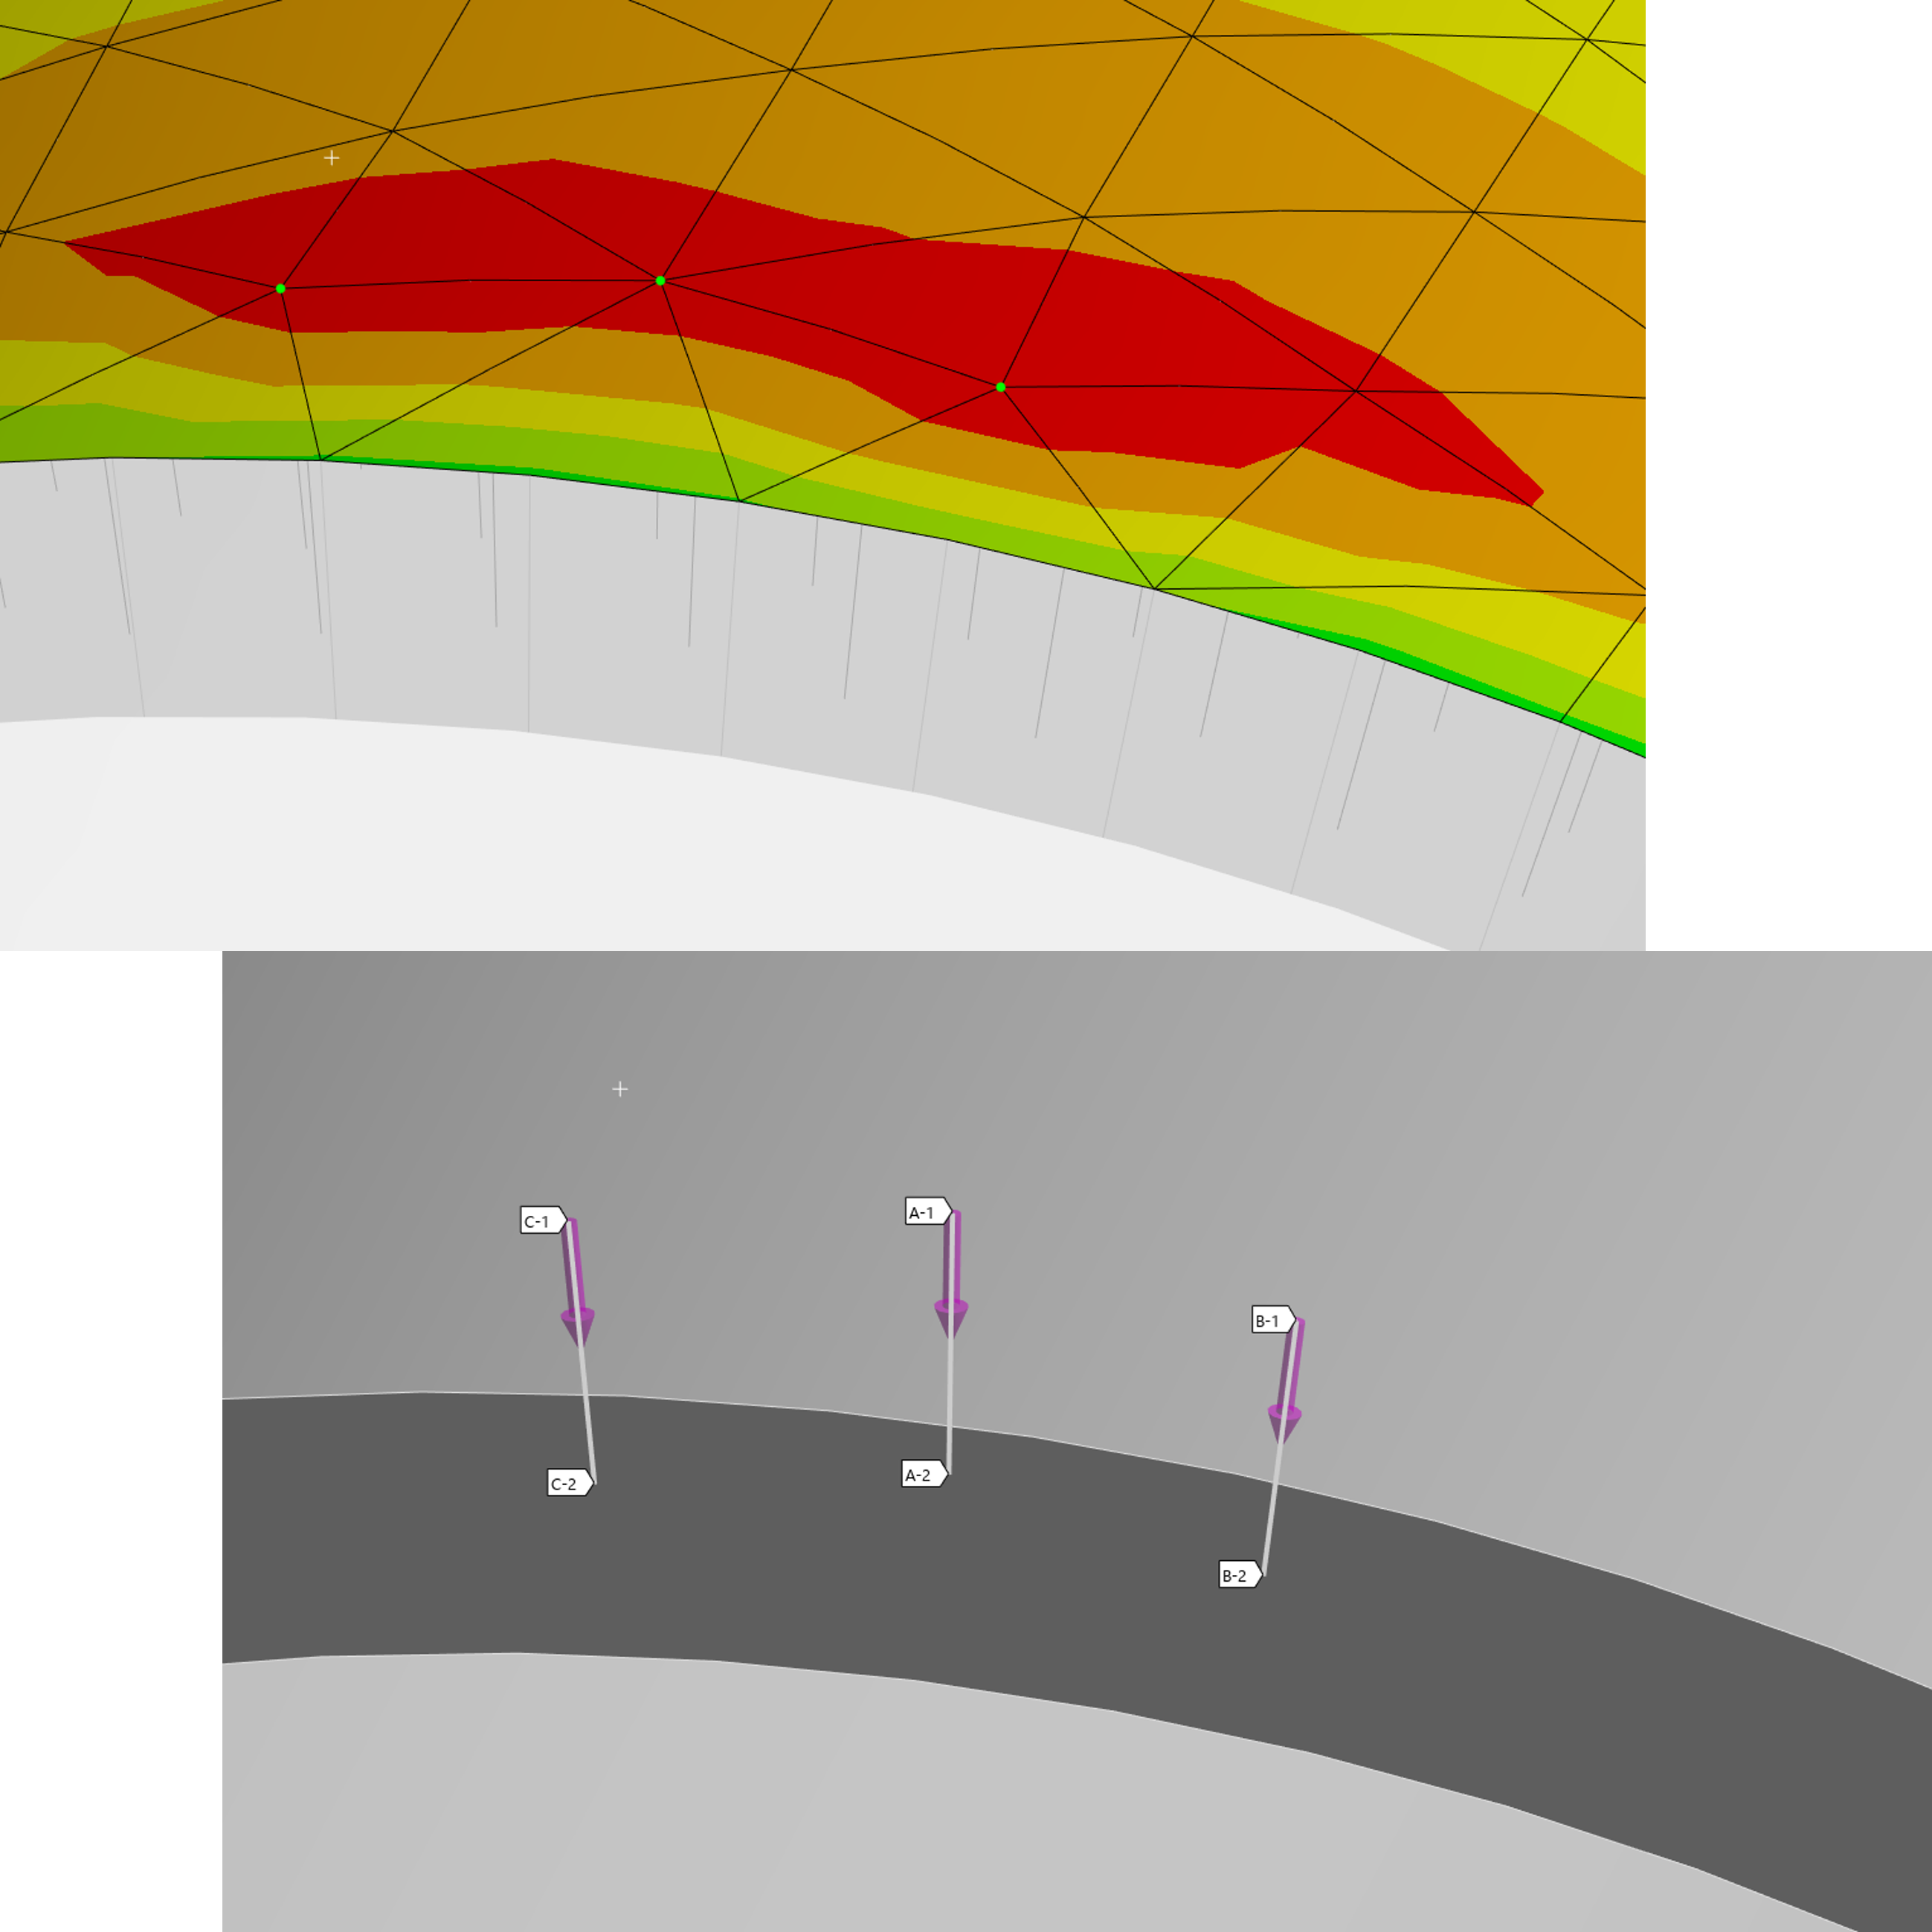
Once the contour results are ready, it is possible to convert LinSight3D SCLs to native Ansys Paths for selected nodes with a single click.
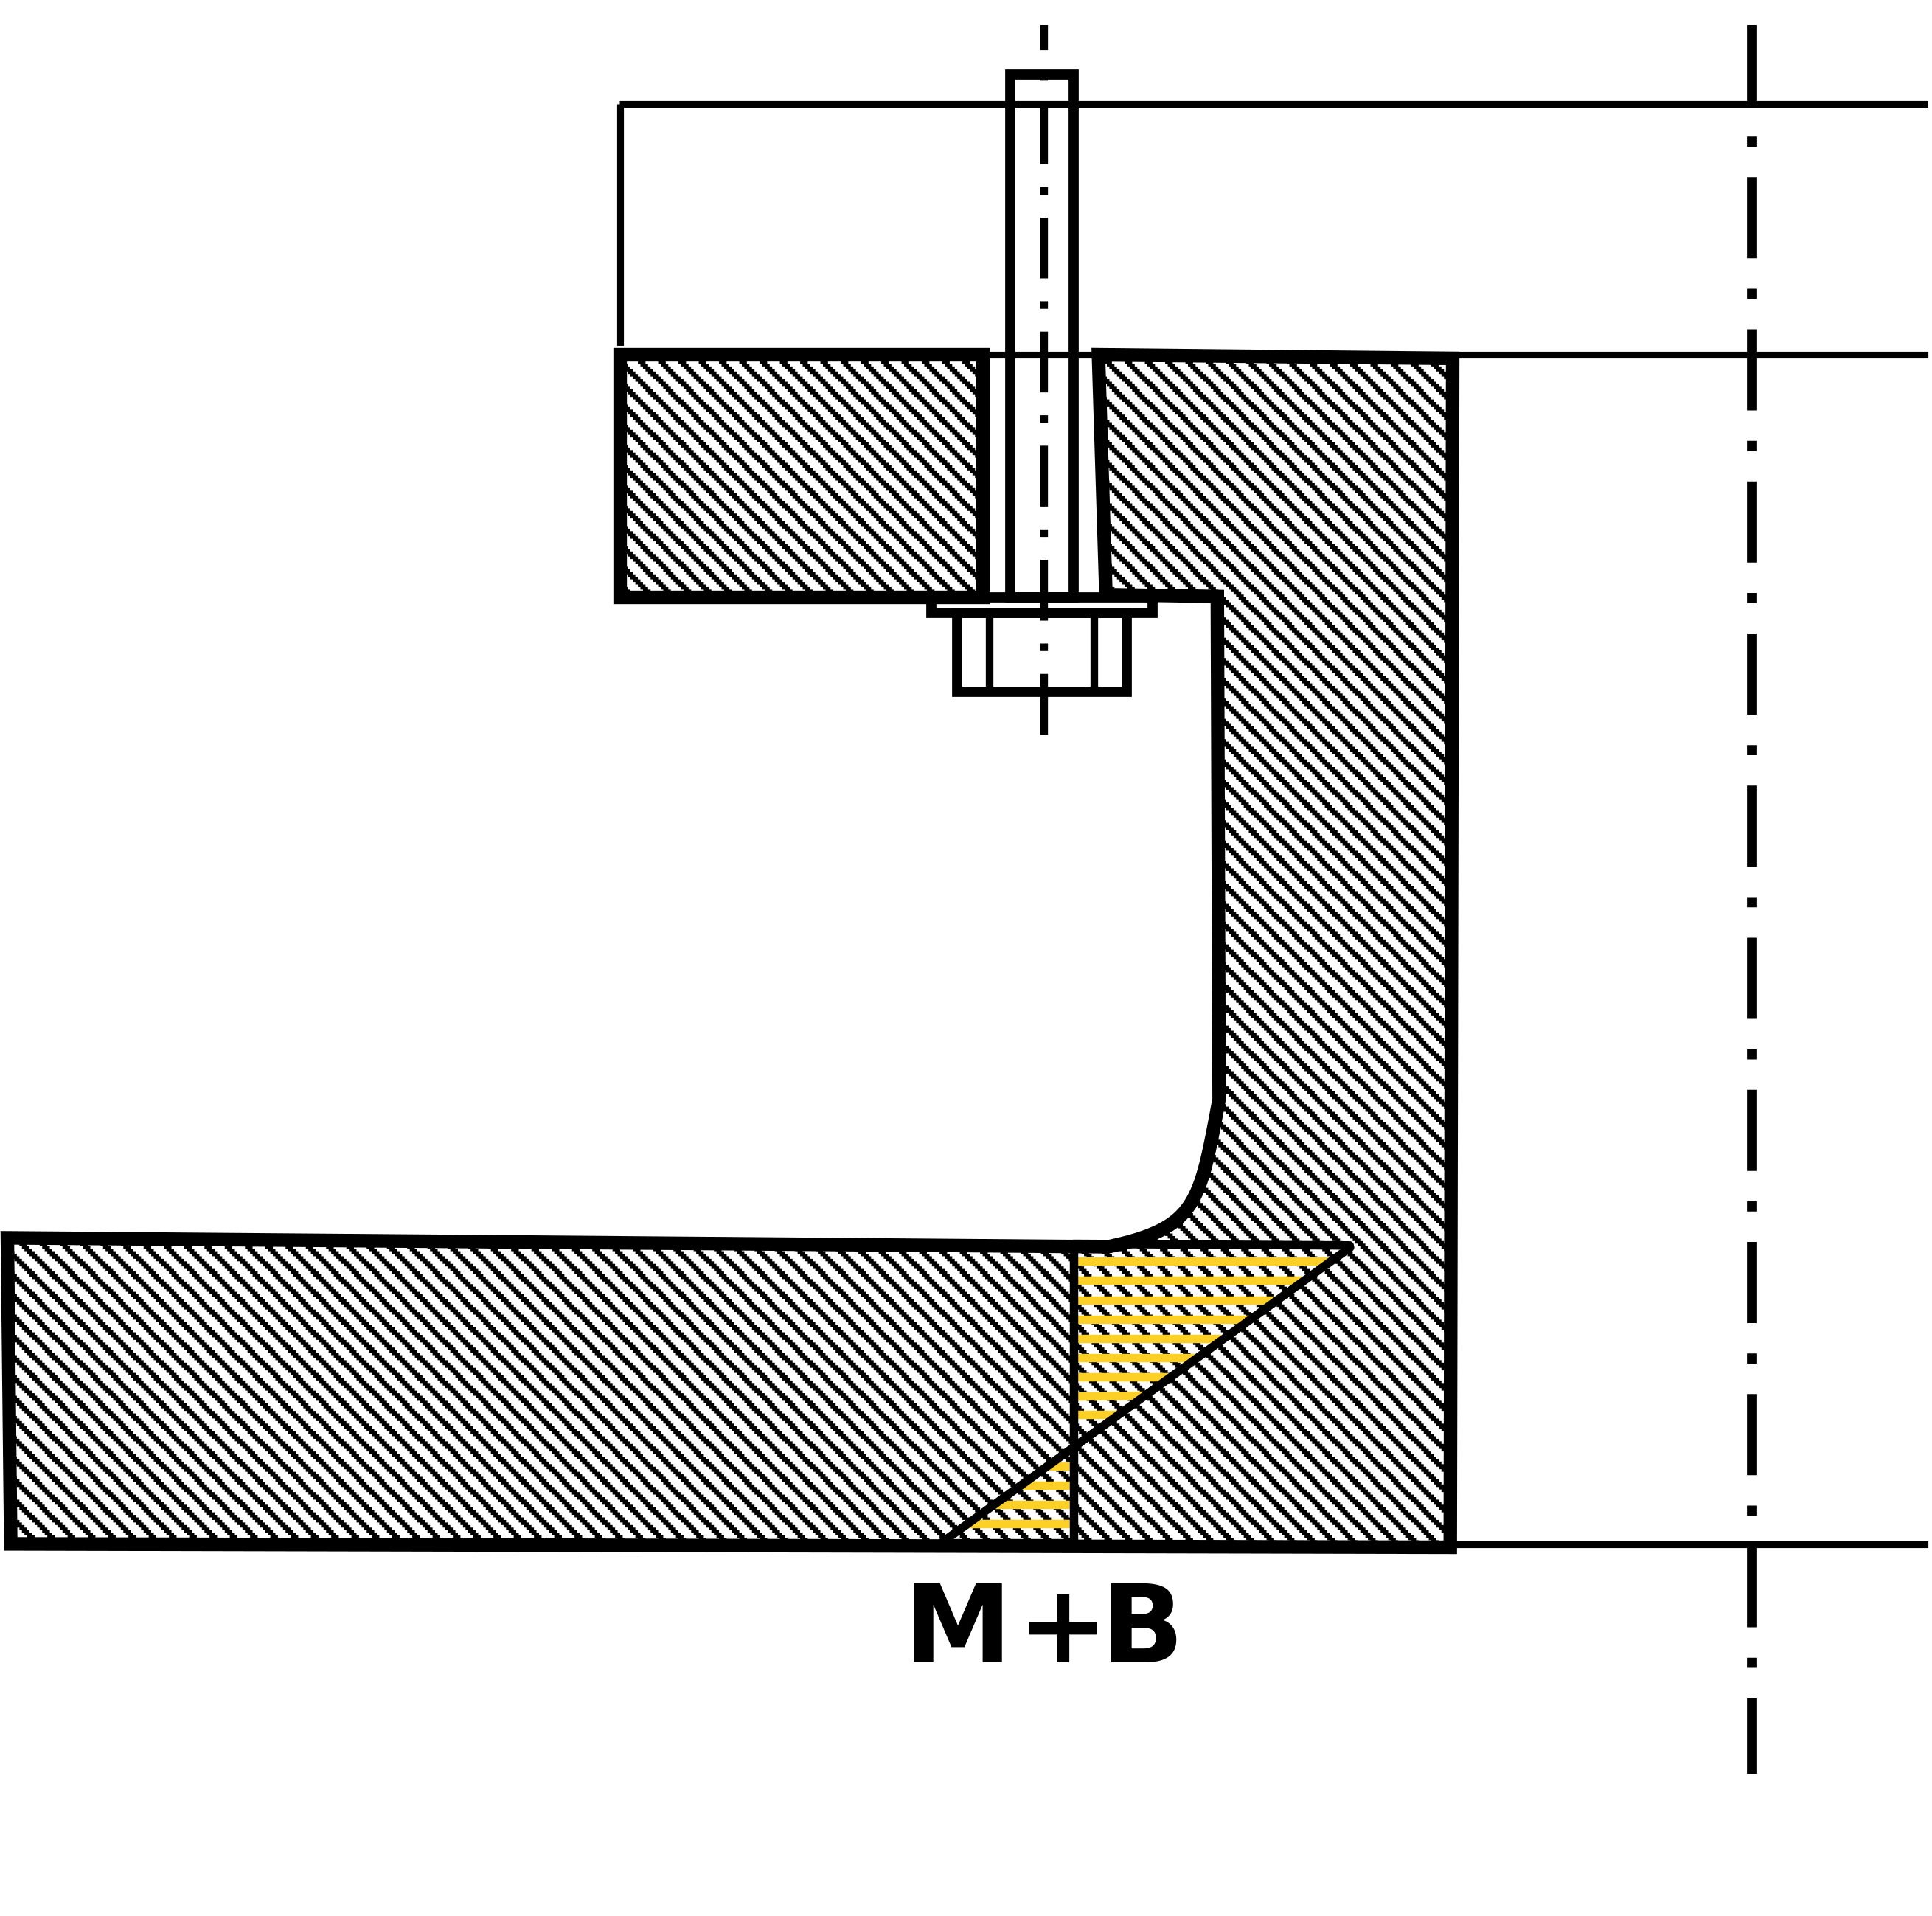
The stress linearization principle remains fundamentally the same regardless of the applicable design code or assessment requirement.
Linearization of many quantities is available:
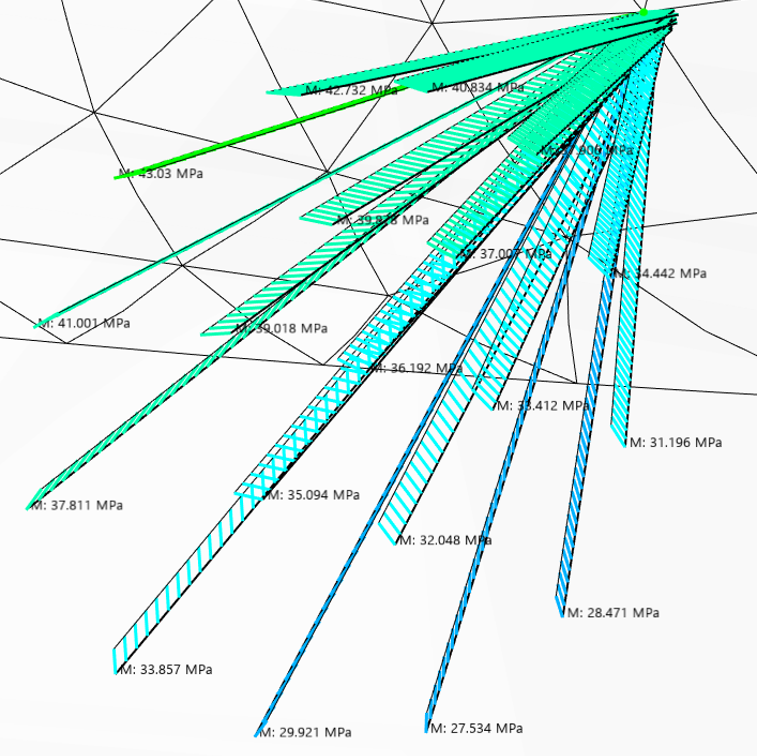
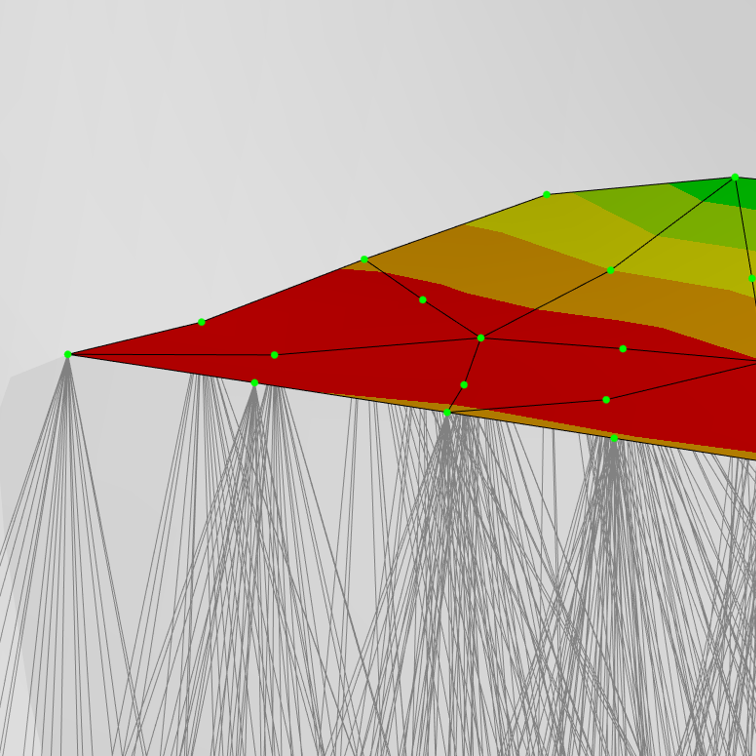
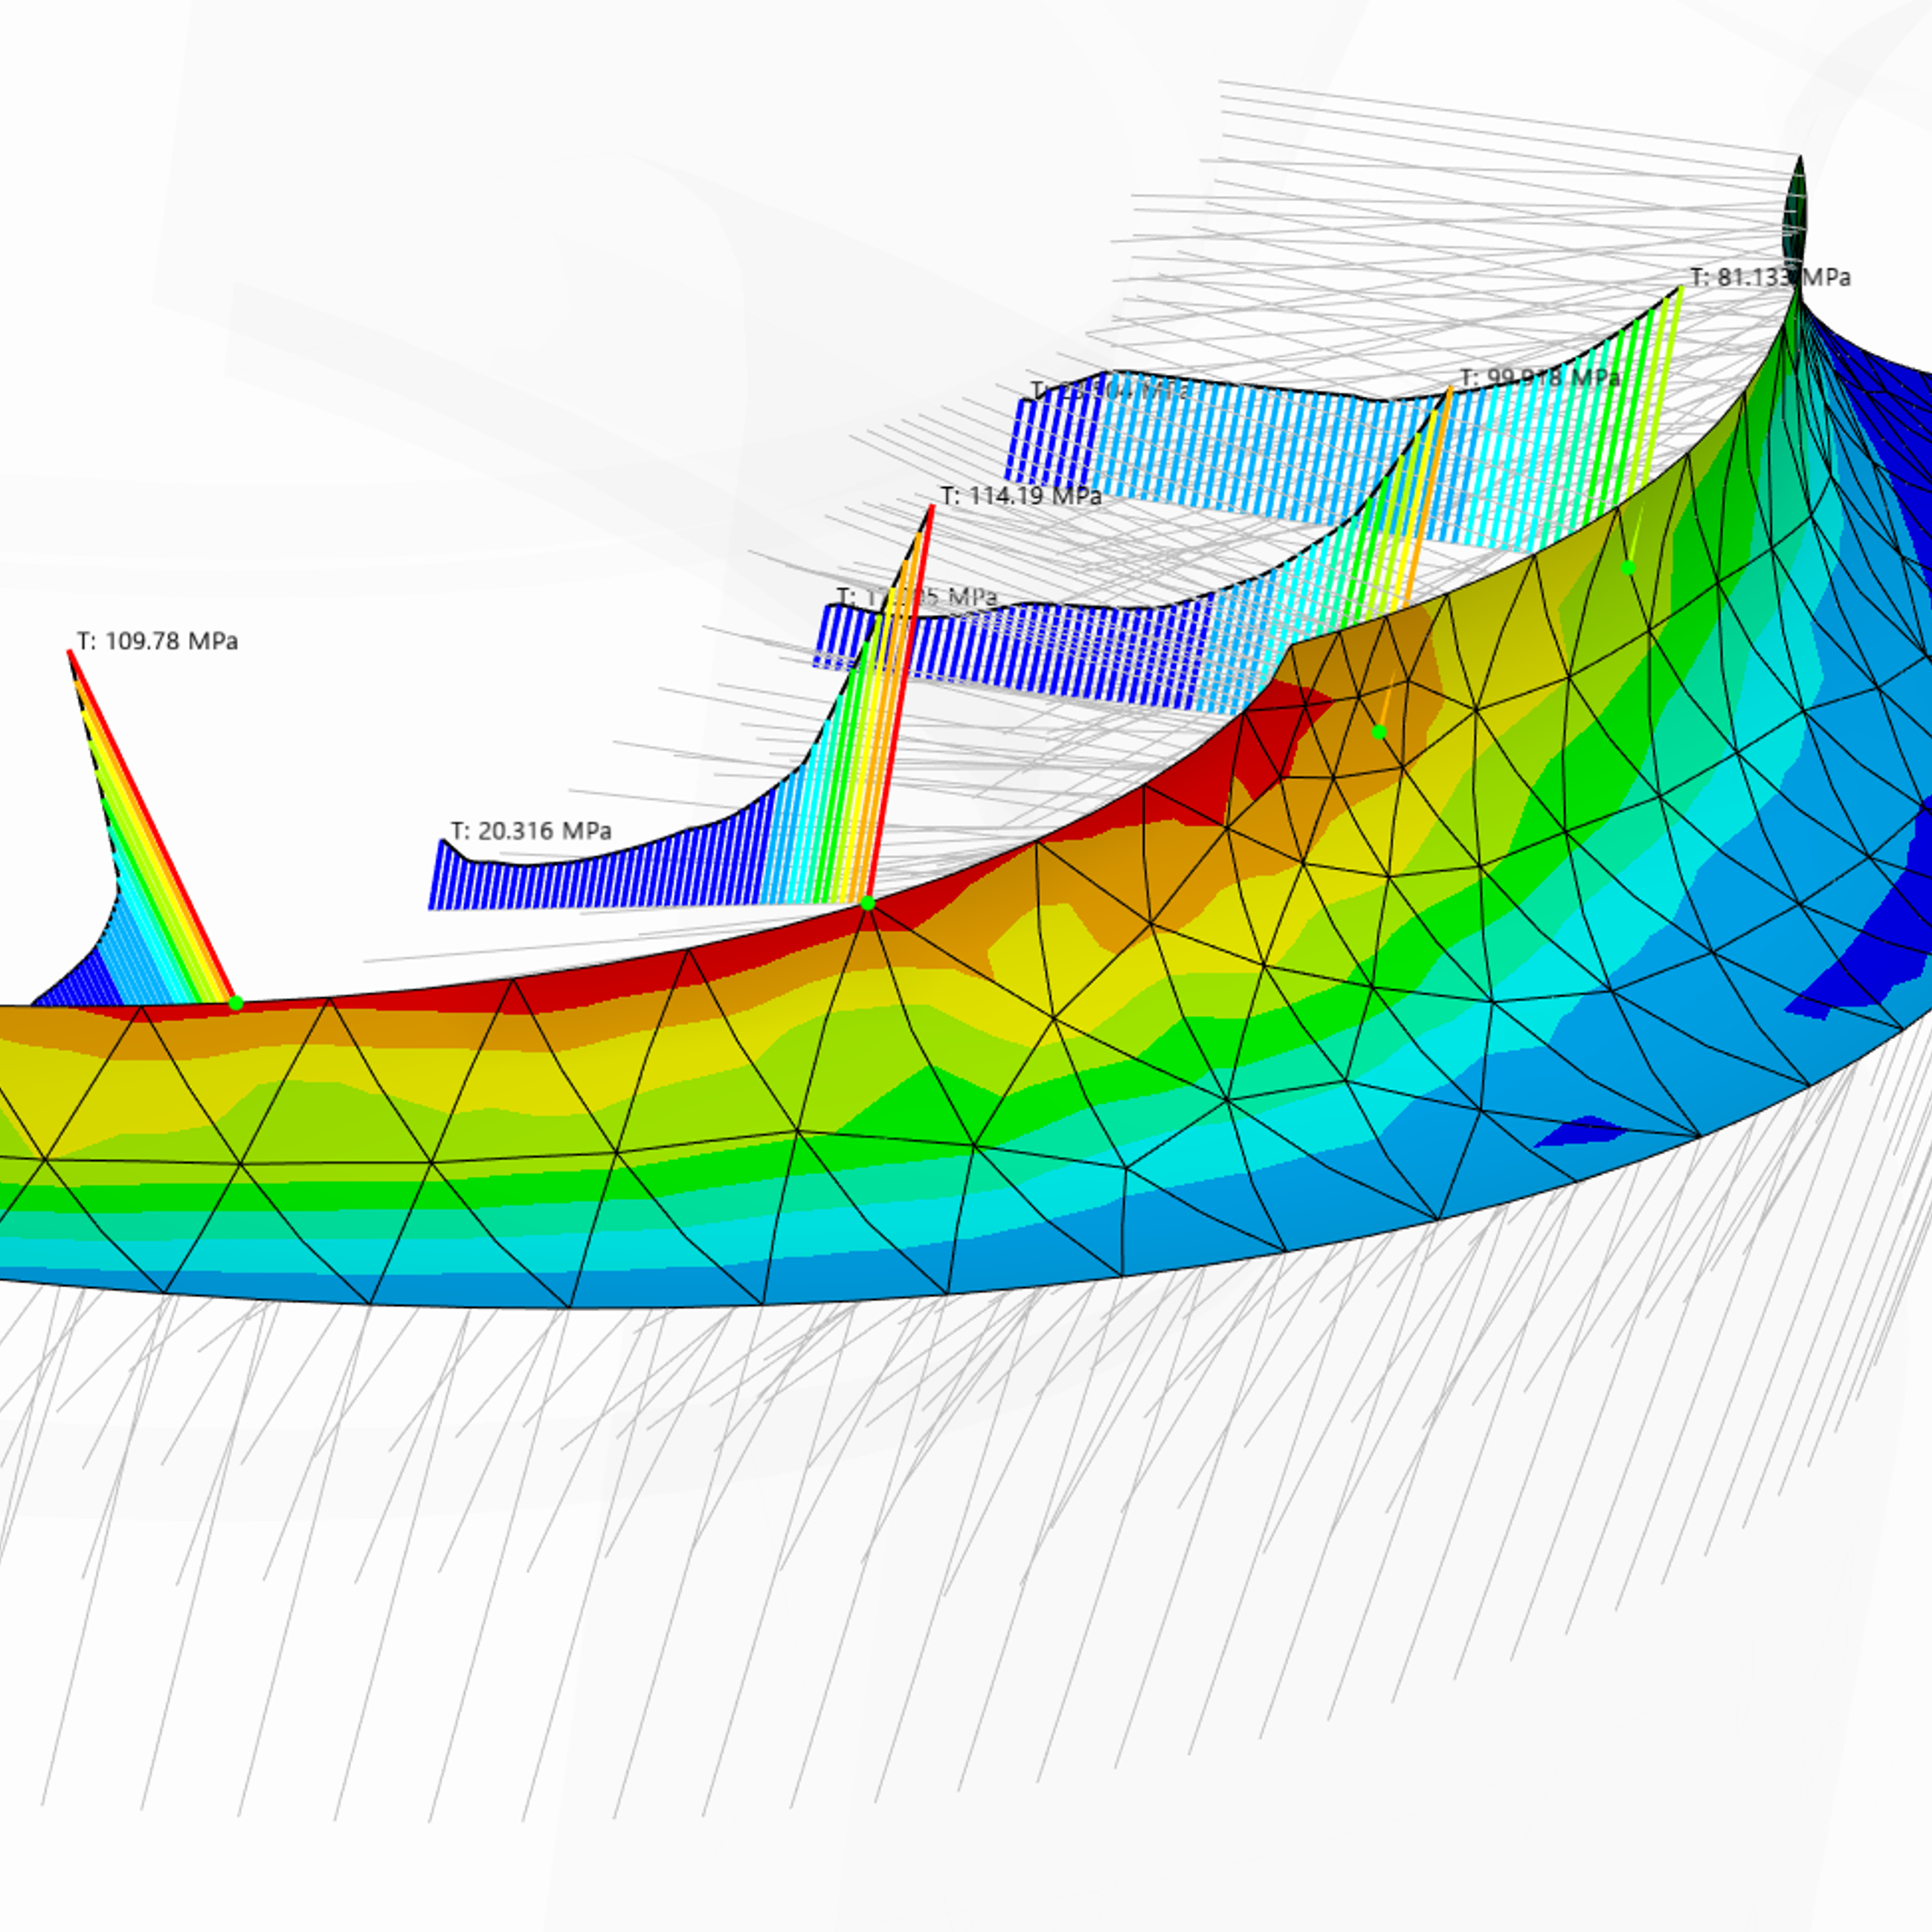
SCL screening automatically evaluates multiple SCLs within a specified cone angle around the surface normal.
The most critical SCL is identified based on the selected linearized stress component. Invalid SCLs are automatically detected and excluded.
Both valid and invalid SCLs can be visualized, together with detailed stress distribution diagrams for result verification.
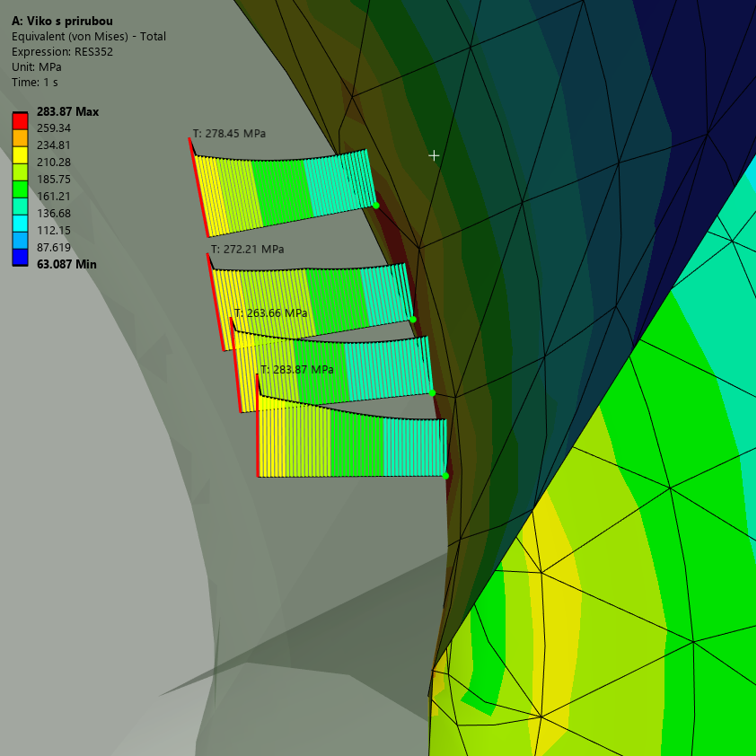
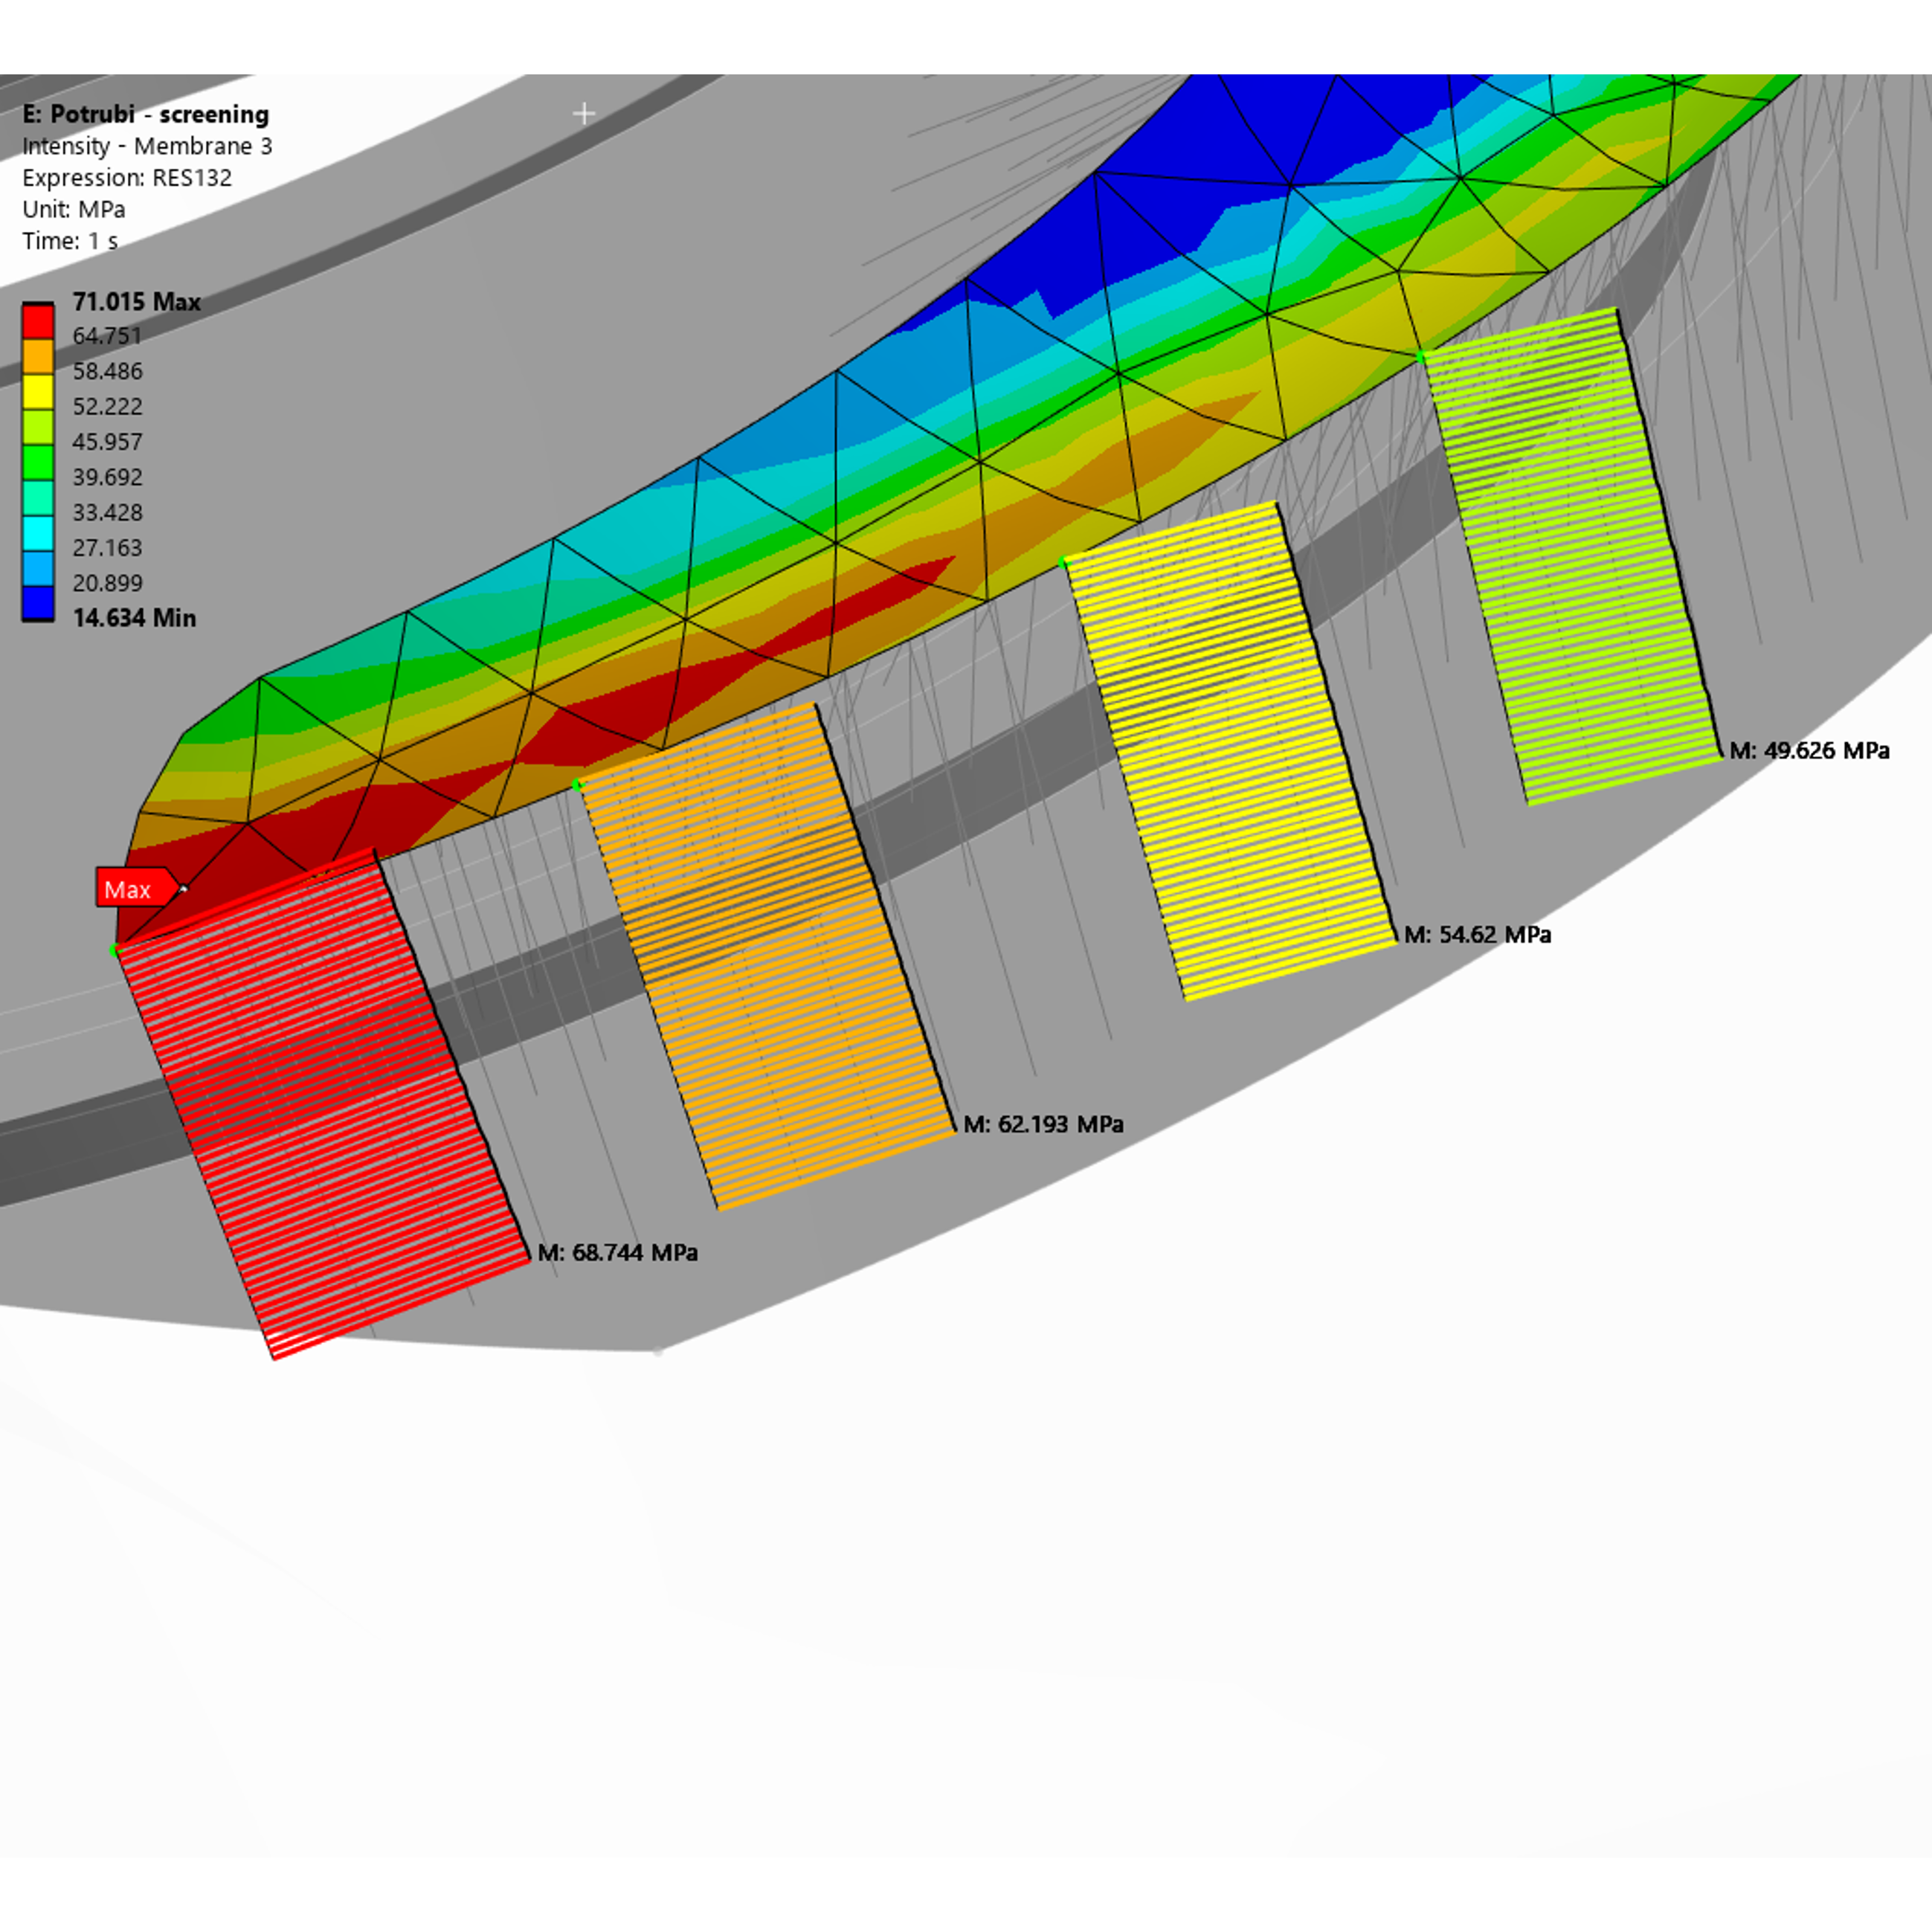
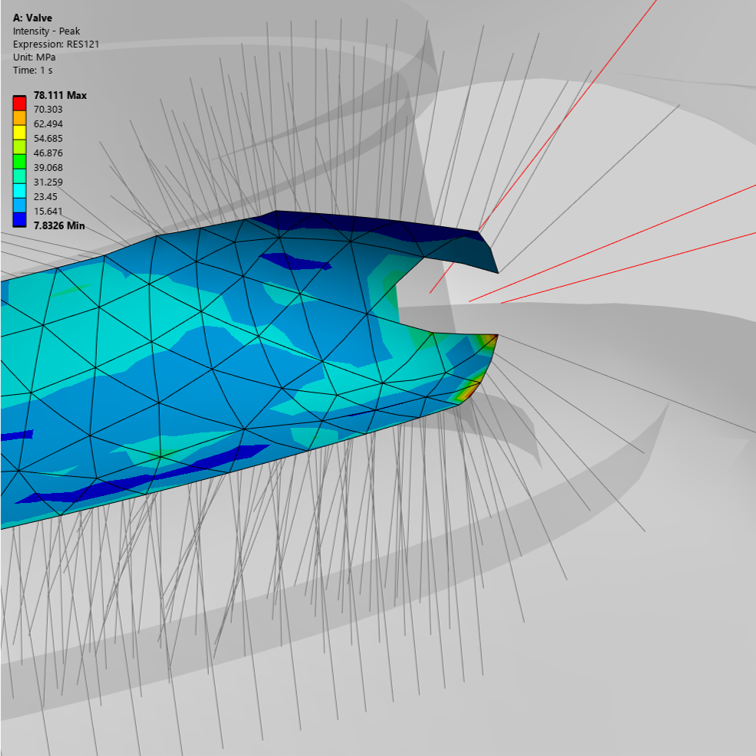
Diagram Visualization provides an interactive graphical representation of linearized stress results along selected SCLs. Membrane (M), Bending (B), Membrane + Bending (M+B), Peak, and Total stress components can be displayed.
Results are linked to the node selection and complemented by 3D graphics , enabling efficient investigation of local through-thickness stress distributions.
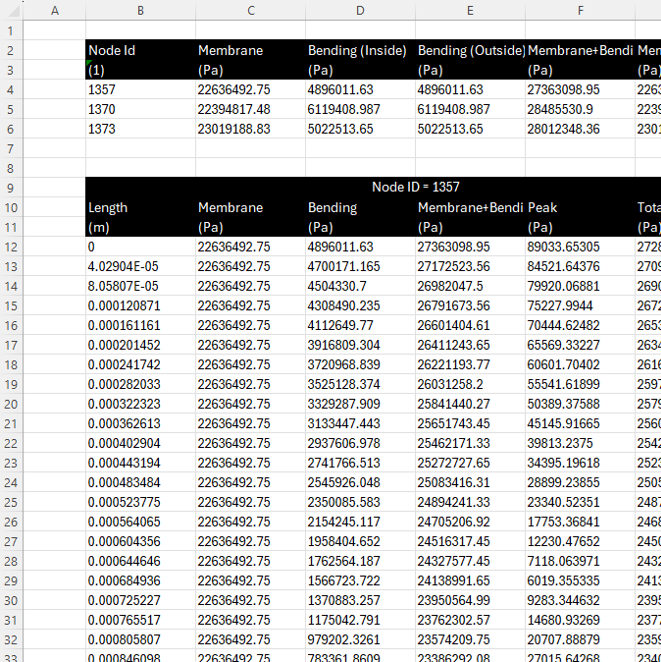
Export of linearized stress components to Excel enables seamless integration with existing assessment and reporting workflows.
Detailed through-thickness stress distributions and linearization results along the selected SCLs are exported.
Linearized stress components at the source, middle and target positions of the selected SCLs are included as well.
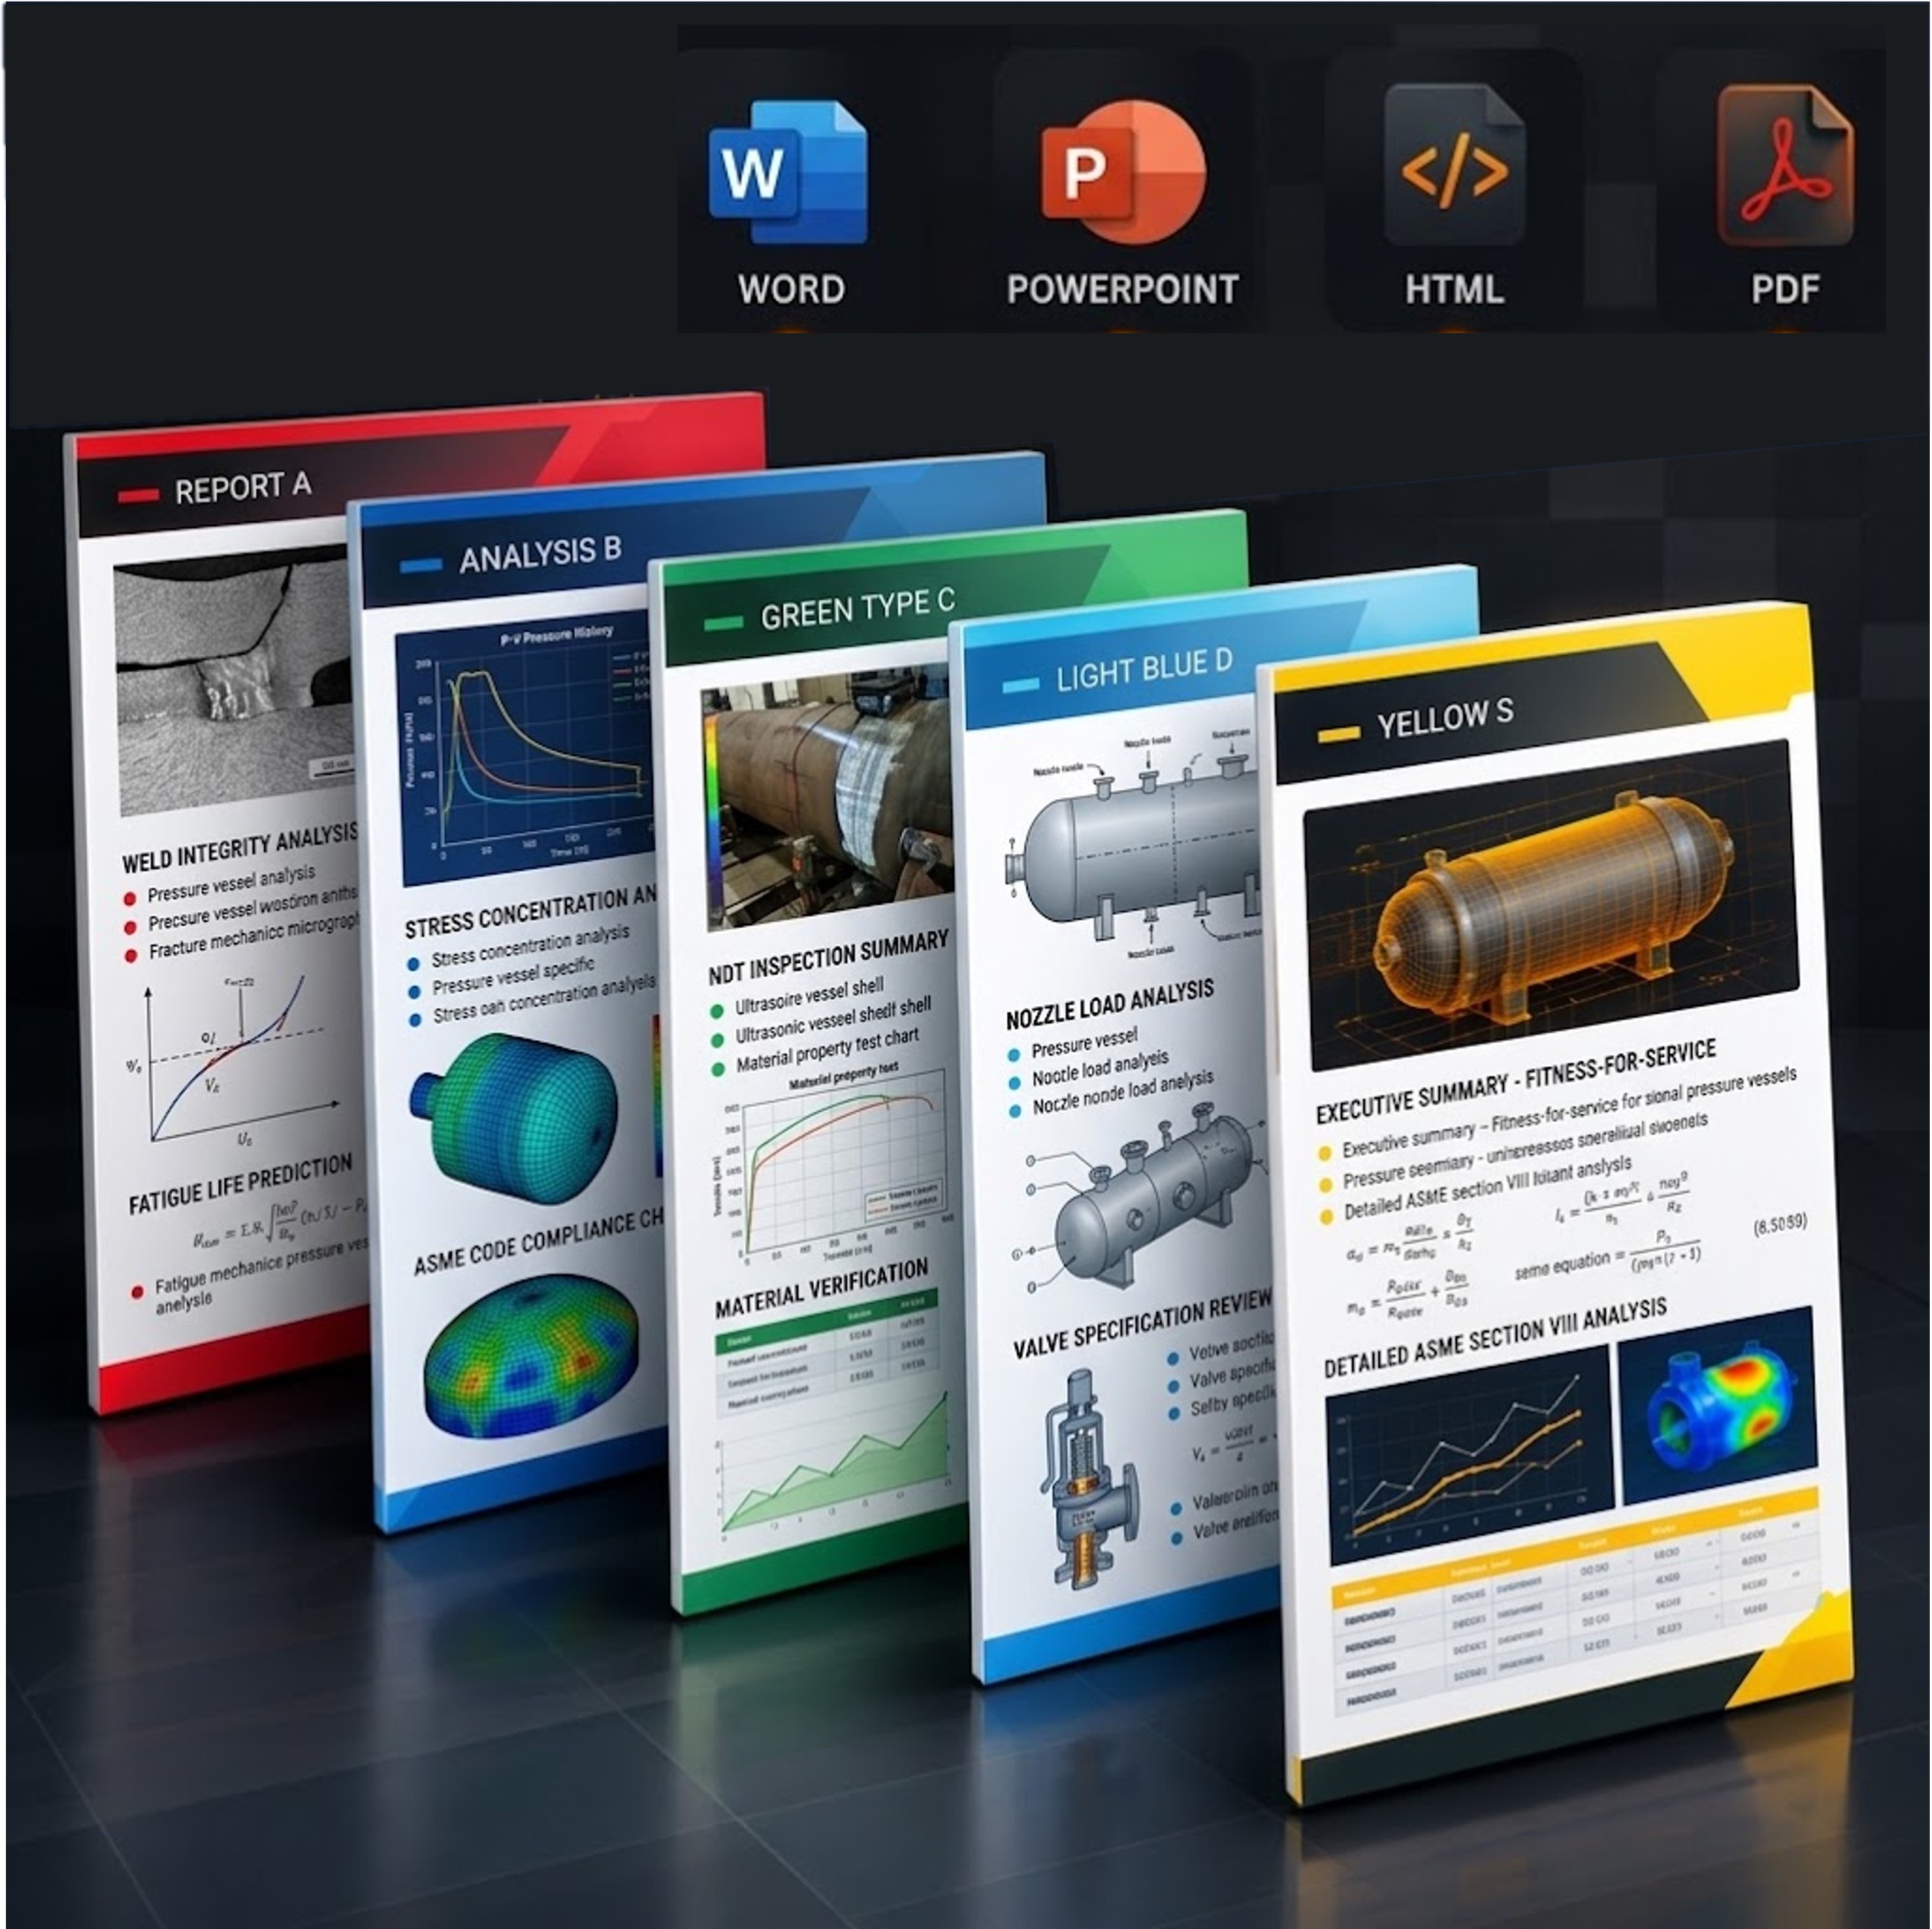
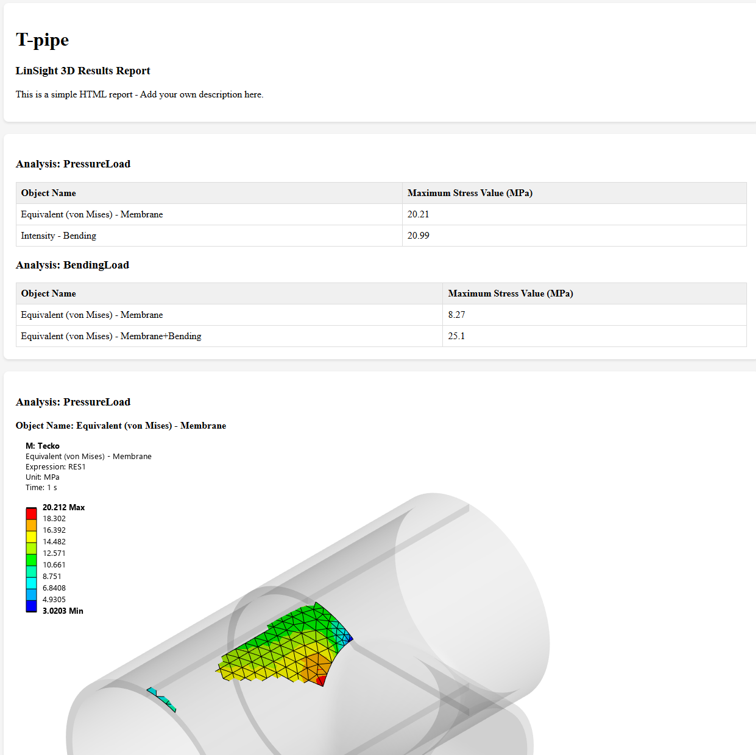
Automatic report generation using a user-defined layout. The report is in HTML format and can be customized to the user's needs.
The report can include graphs, tables, pictures and custom post-processing and assessment.
Embedded support for user-defined Python scripts, enabling easy customization and multiple report layouts.
?"How do I know the SCL is really the critical one? Have I missed the real hotspot?"
If you are interested in what is "under the hood" of our tool, this section provides the answers. You can dive deeper into the principles behind [LinSight3D] inside Ansys.
The contour plot is assembled from individual linearizations along Stress Classification Lines (SCLs) using the following procedure.
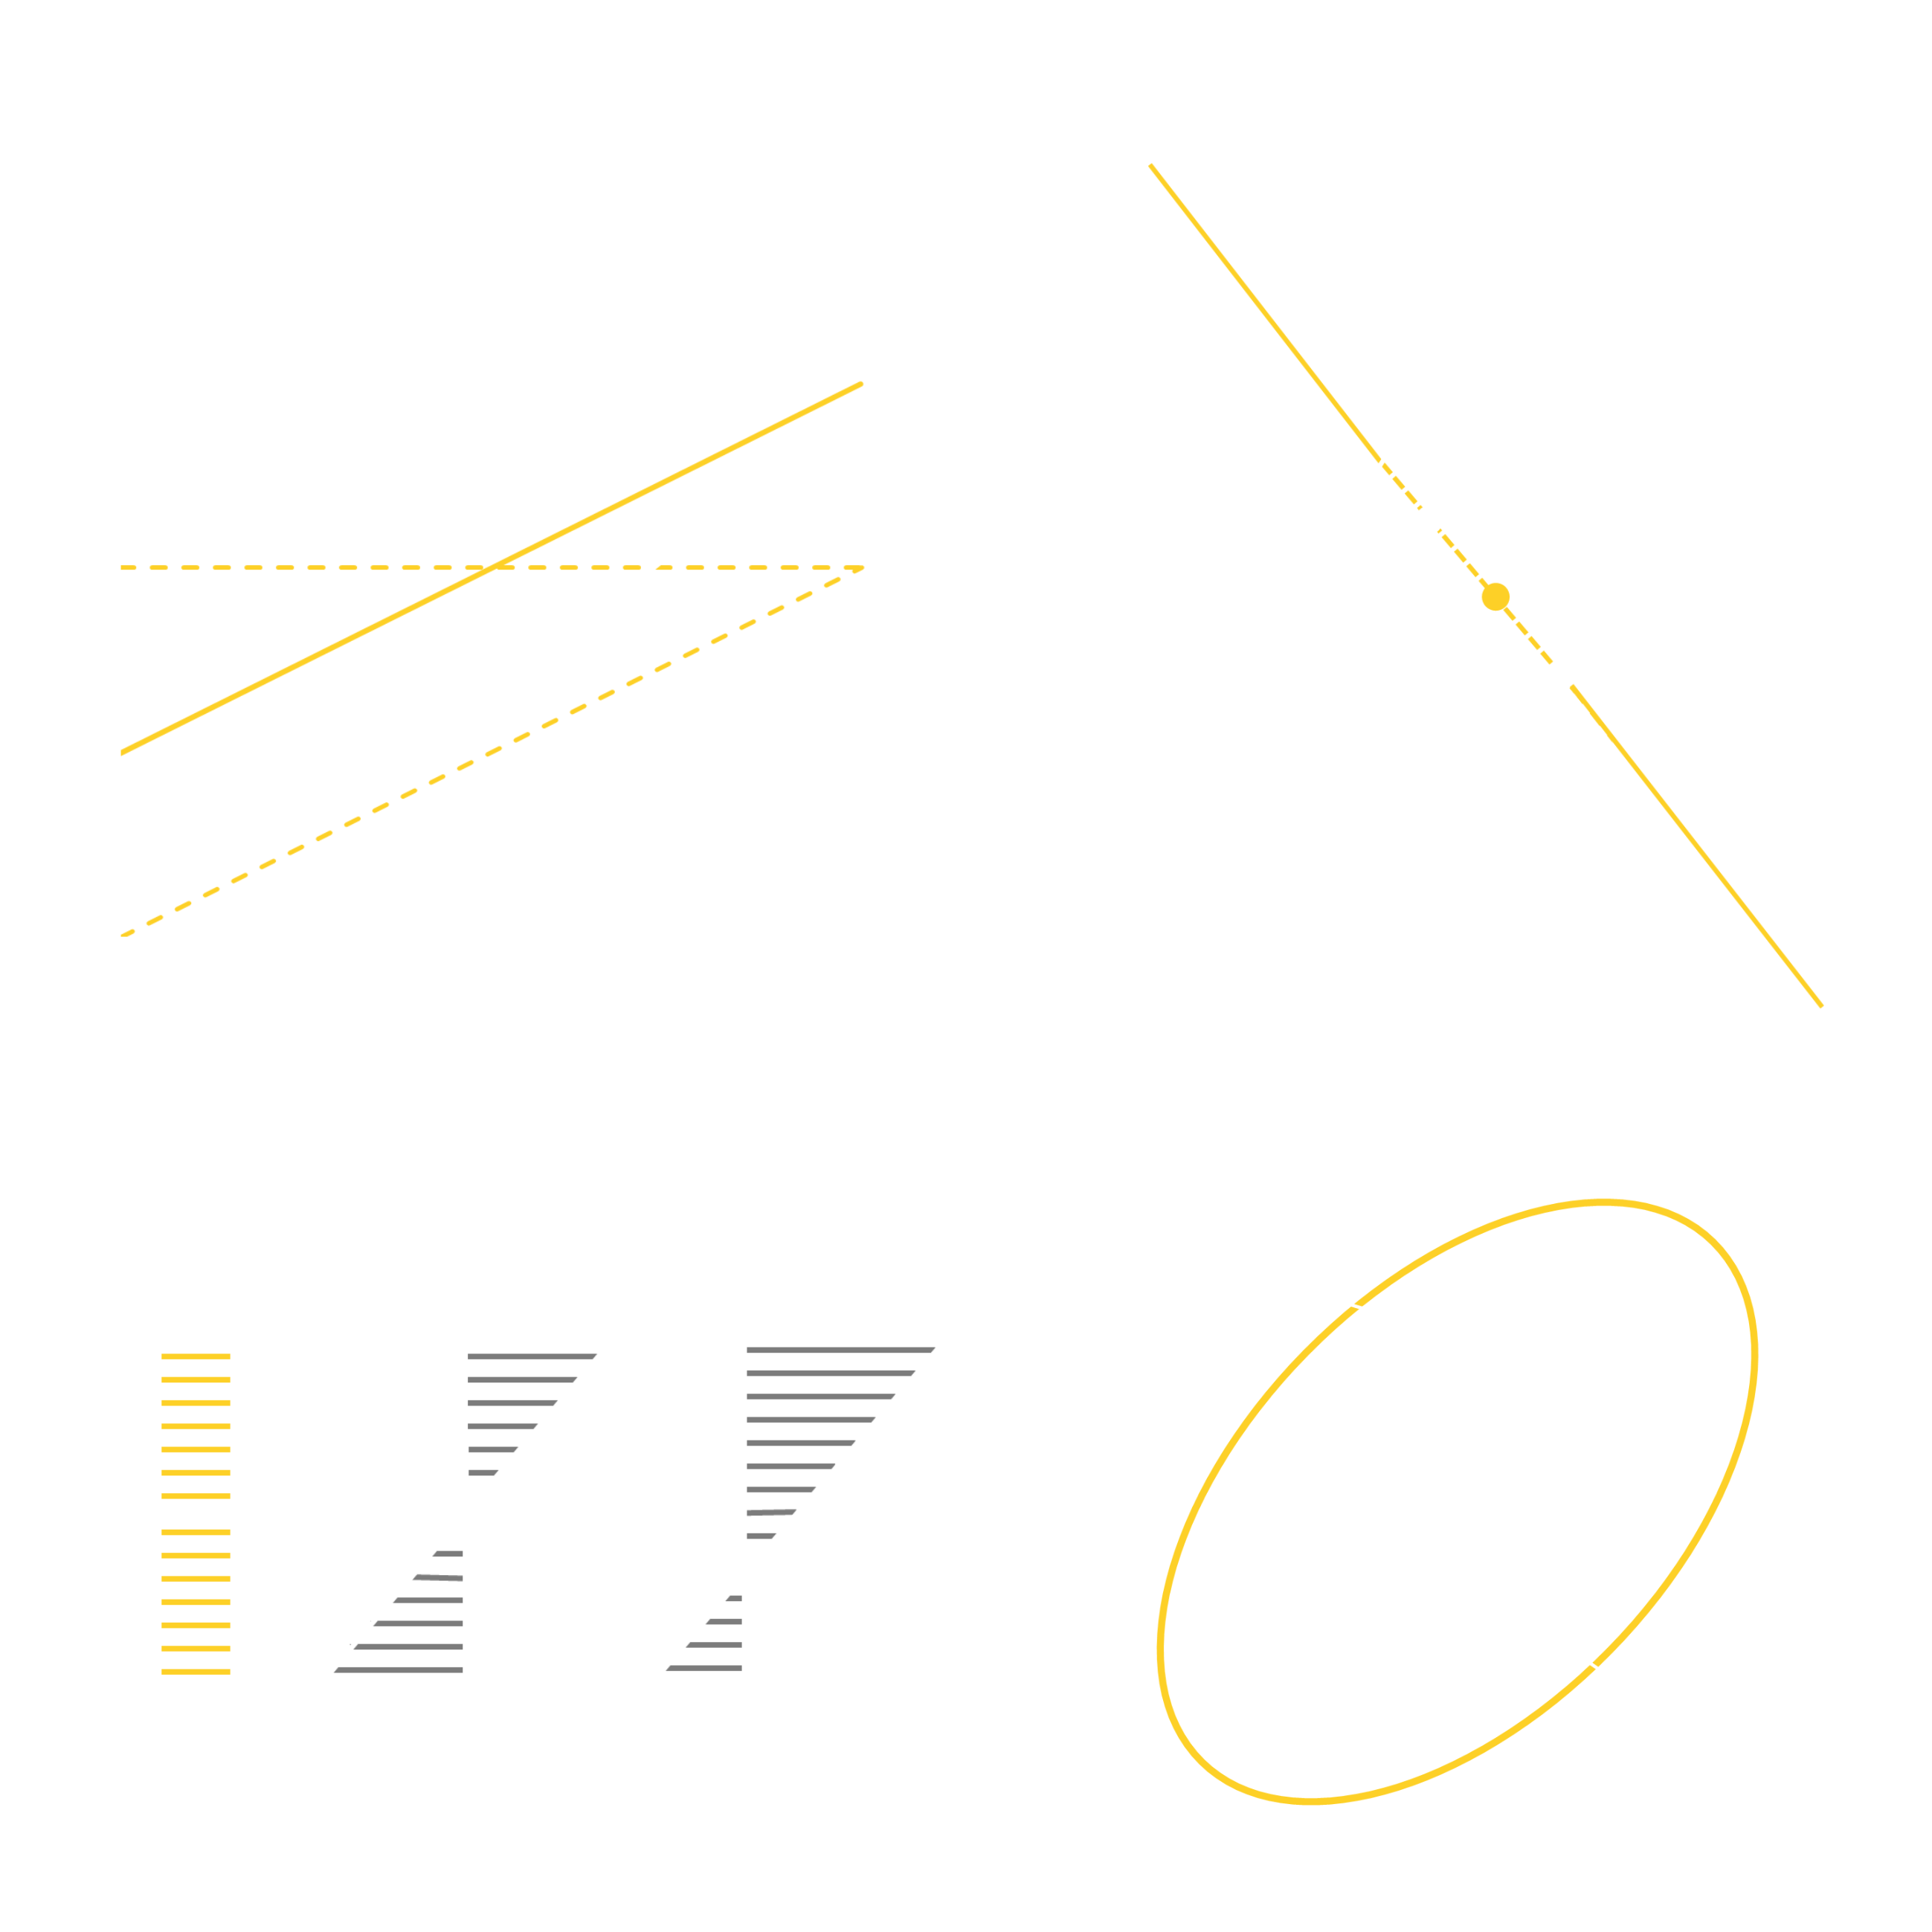
A Stress Classification Line (SCL) is a through-thickness evaluation path used in finite element analysis (FEA) to extract and linearize stresses into membrane, bending, and peak components for code-based structural assessment.
SCLs are widely used in Design by Analysis (DBA) procedures according to codes and standards such as ASME Boiler and Pressure Vessel Code (BPVC) VIII, EN 13445, KTA 3201.2, PD 5500, CODAP.
In Ansys Mechanical, an SCL is implemented as a standard Ansys object. Stress values are interpolated along this path and subsequently processed using a line-integral method to obtain membrane, bending, peak, and total stress components.
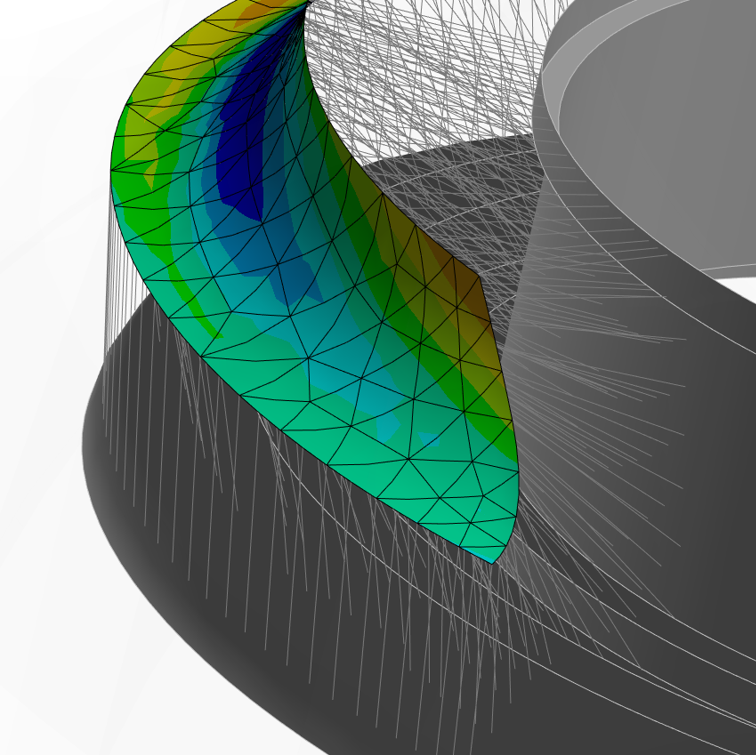
Perpendicular rays are generated from the selected surface.
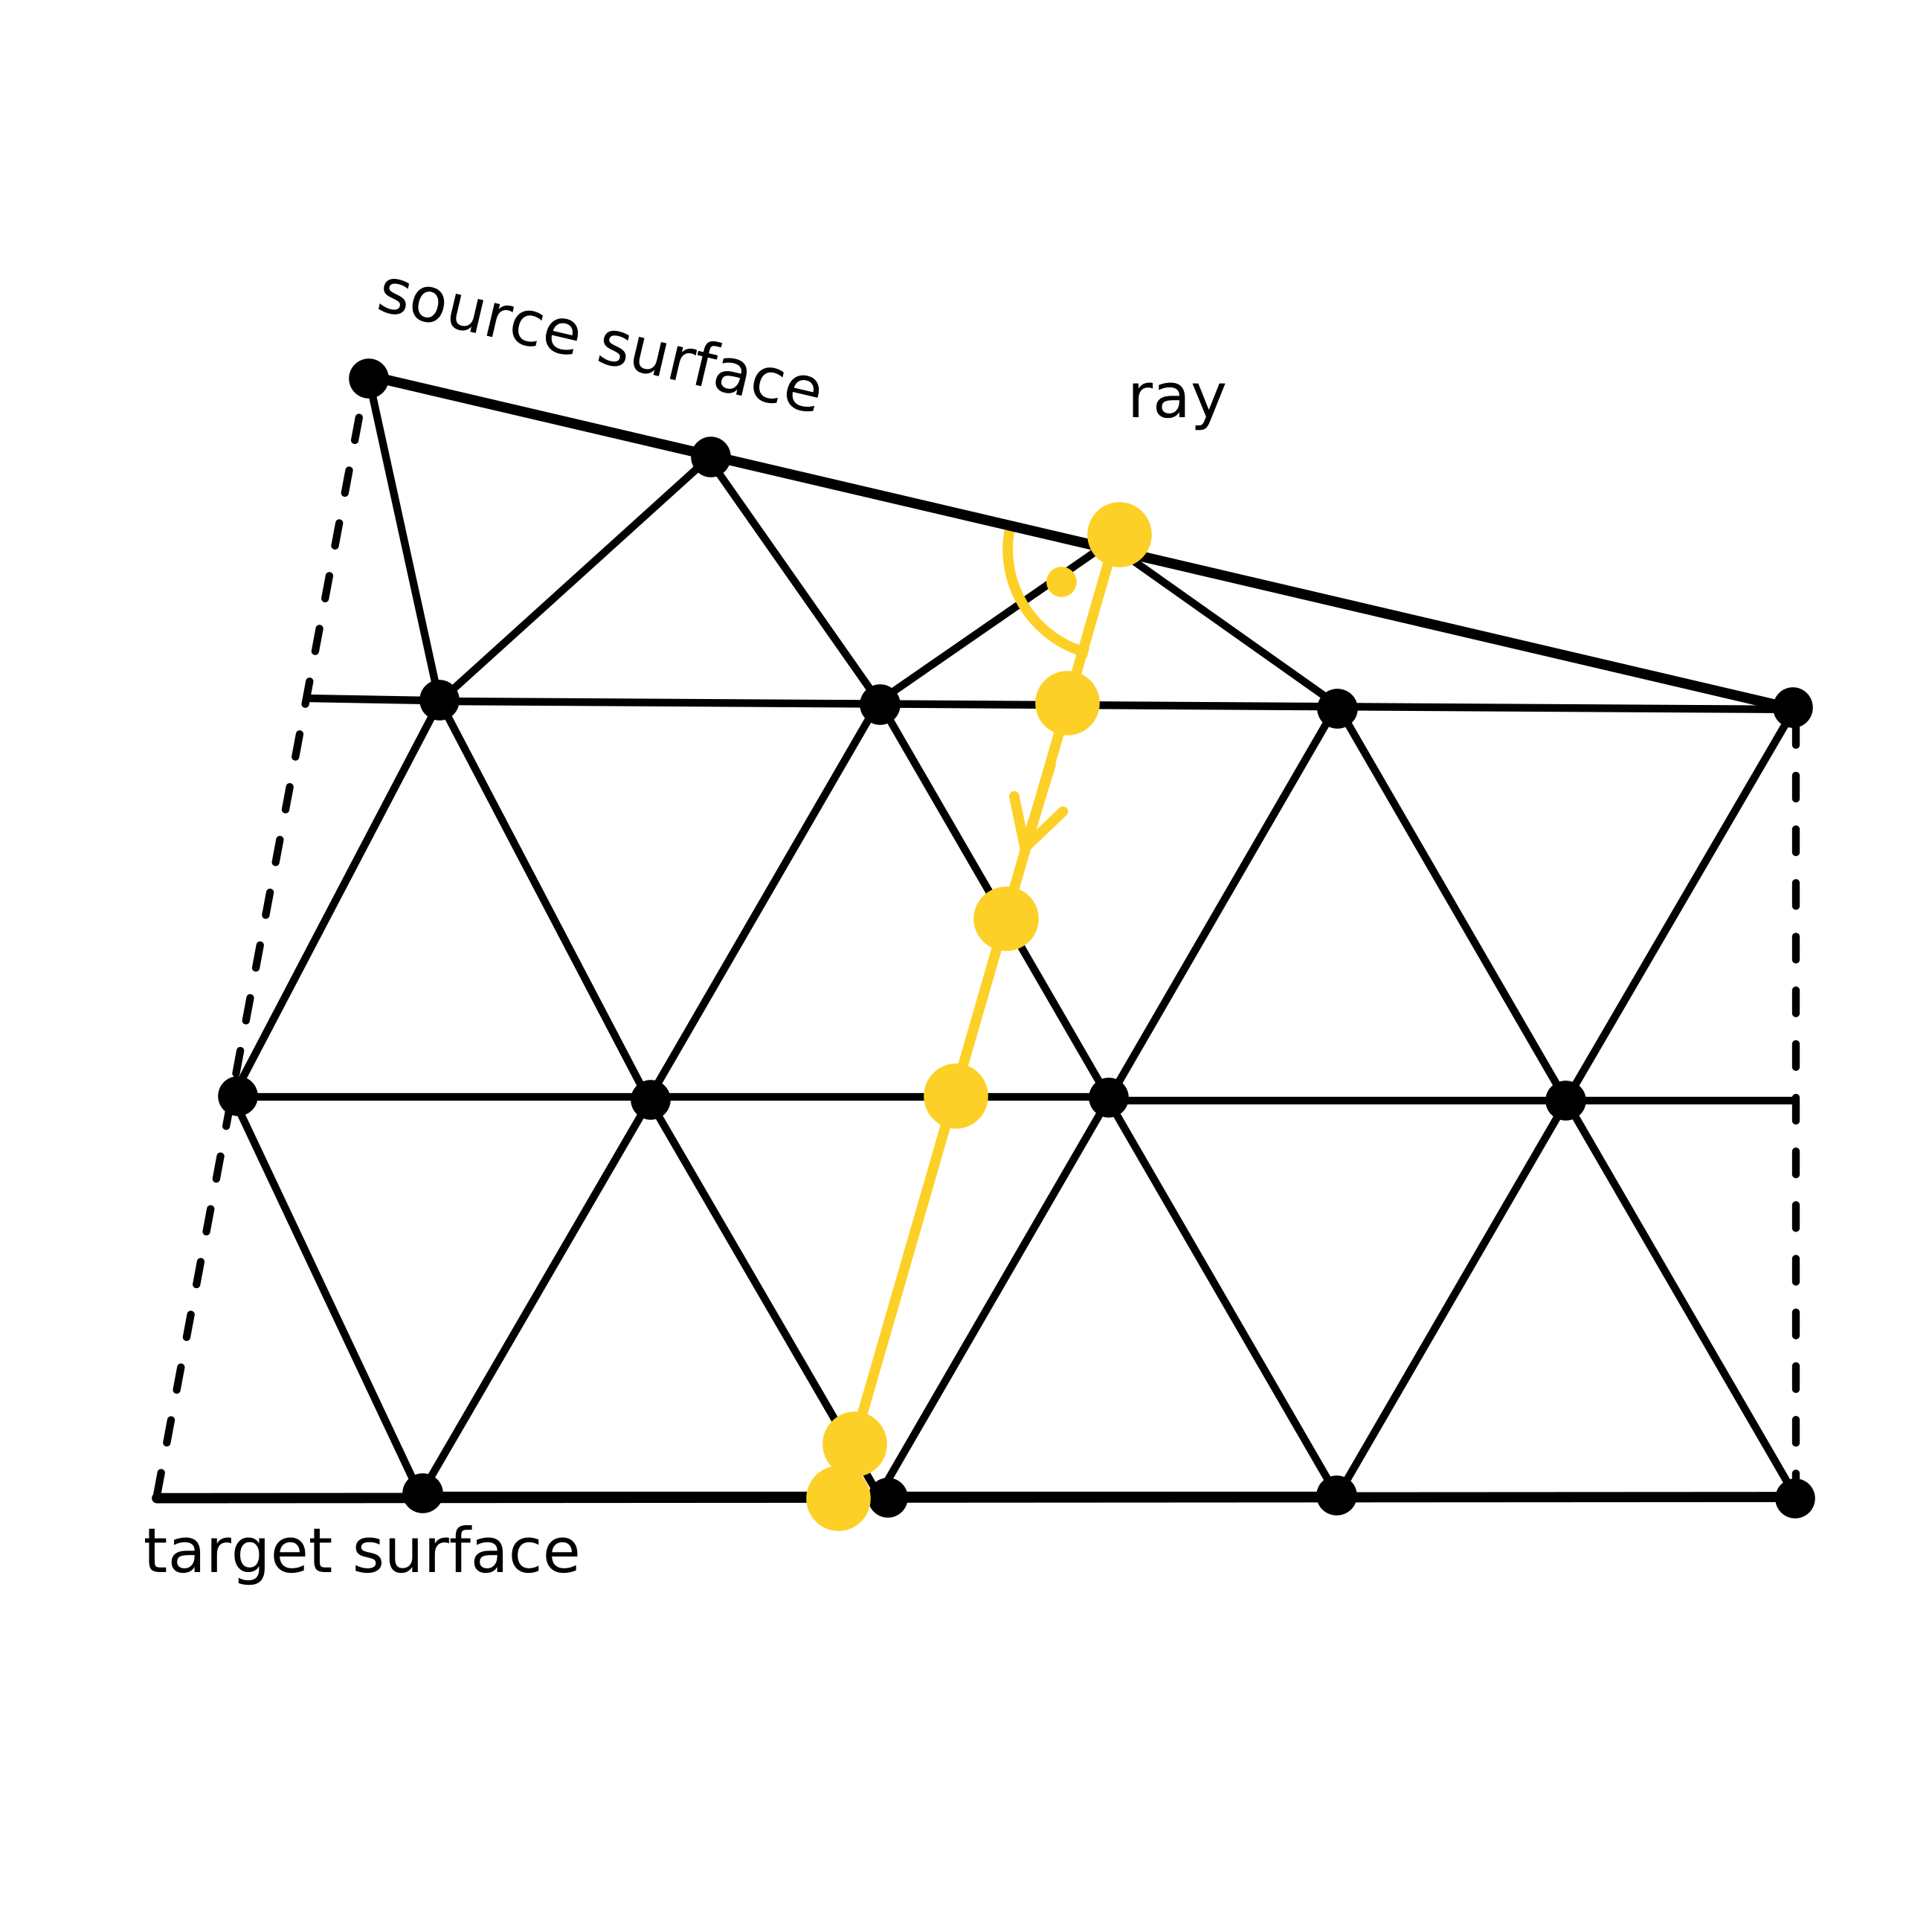
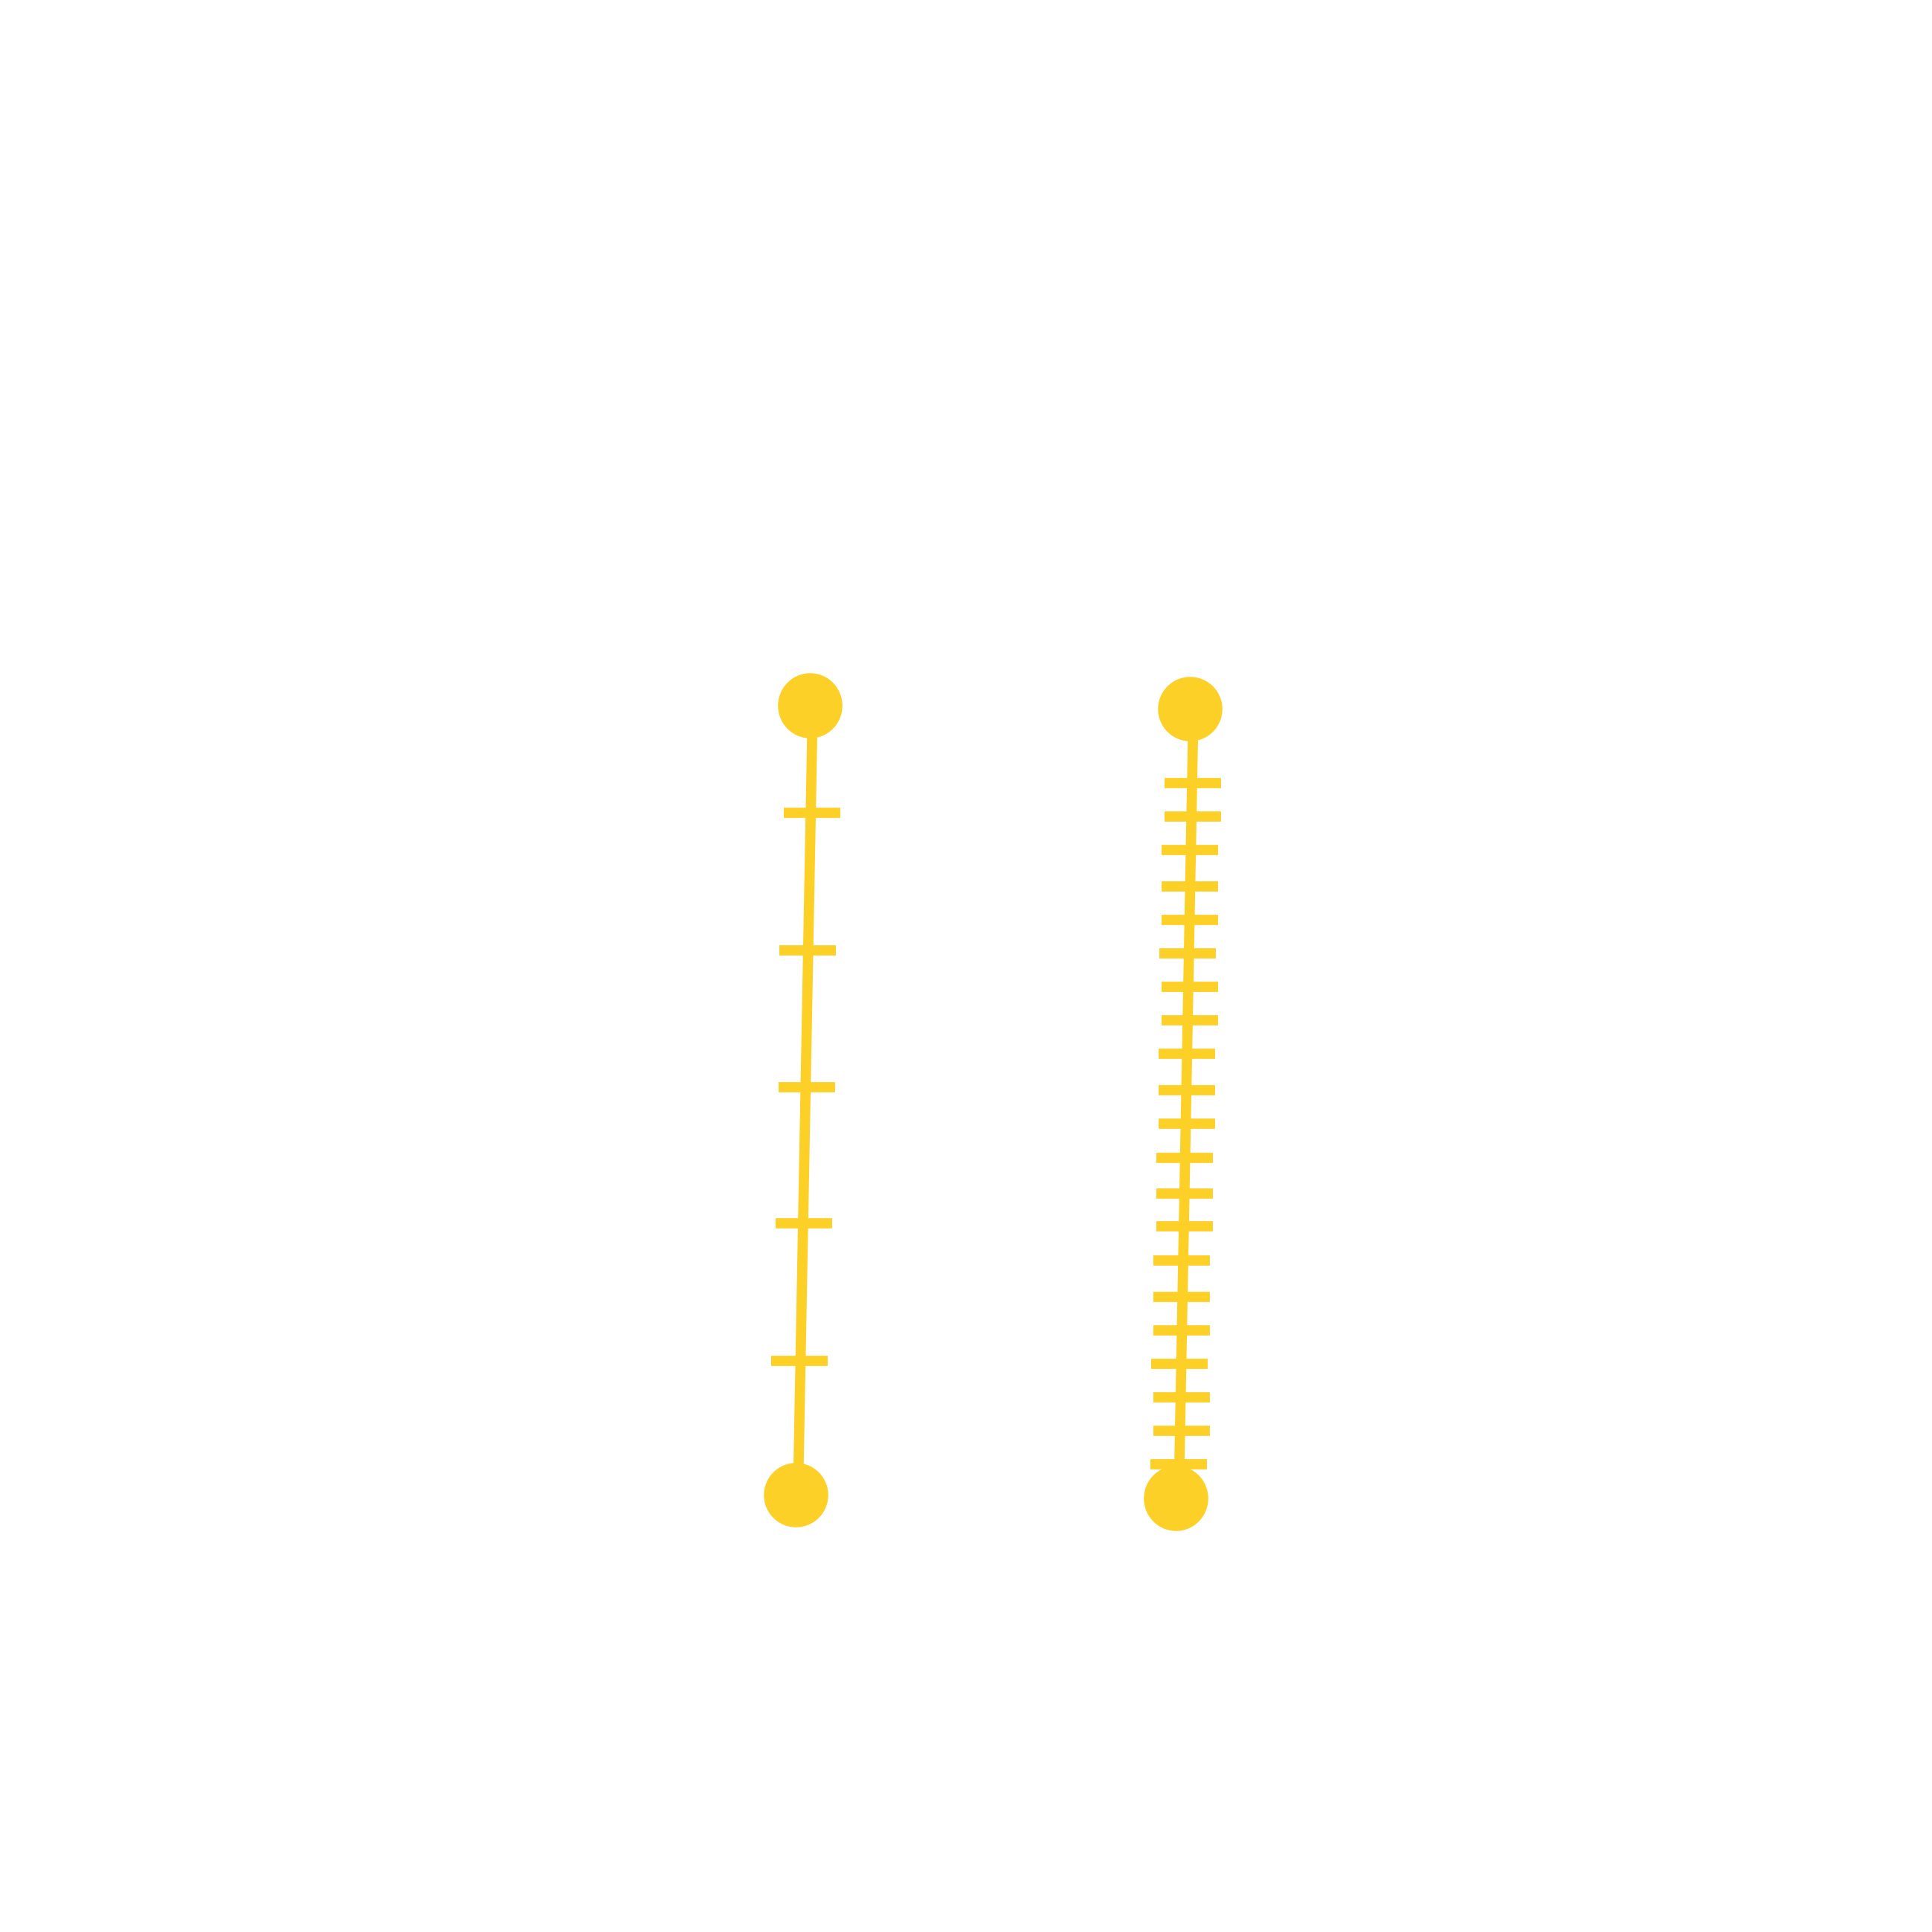
The SCL is discretized into a series of sampling points along its length.
A higher number of sampling points increases the accuracy, but it also increases the computation time.
Two sampling strategies are available:
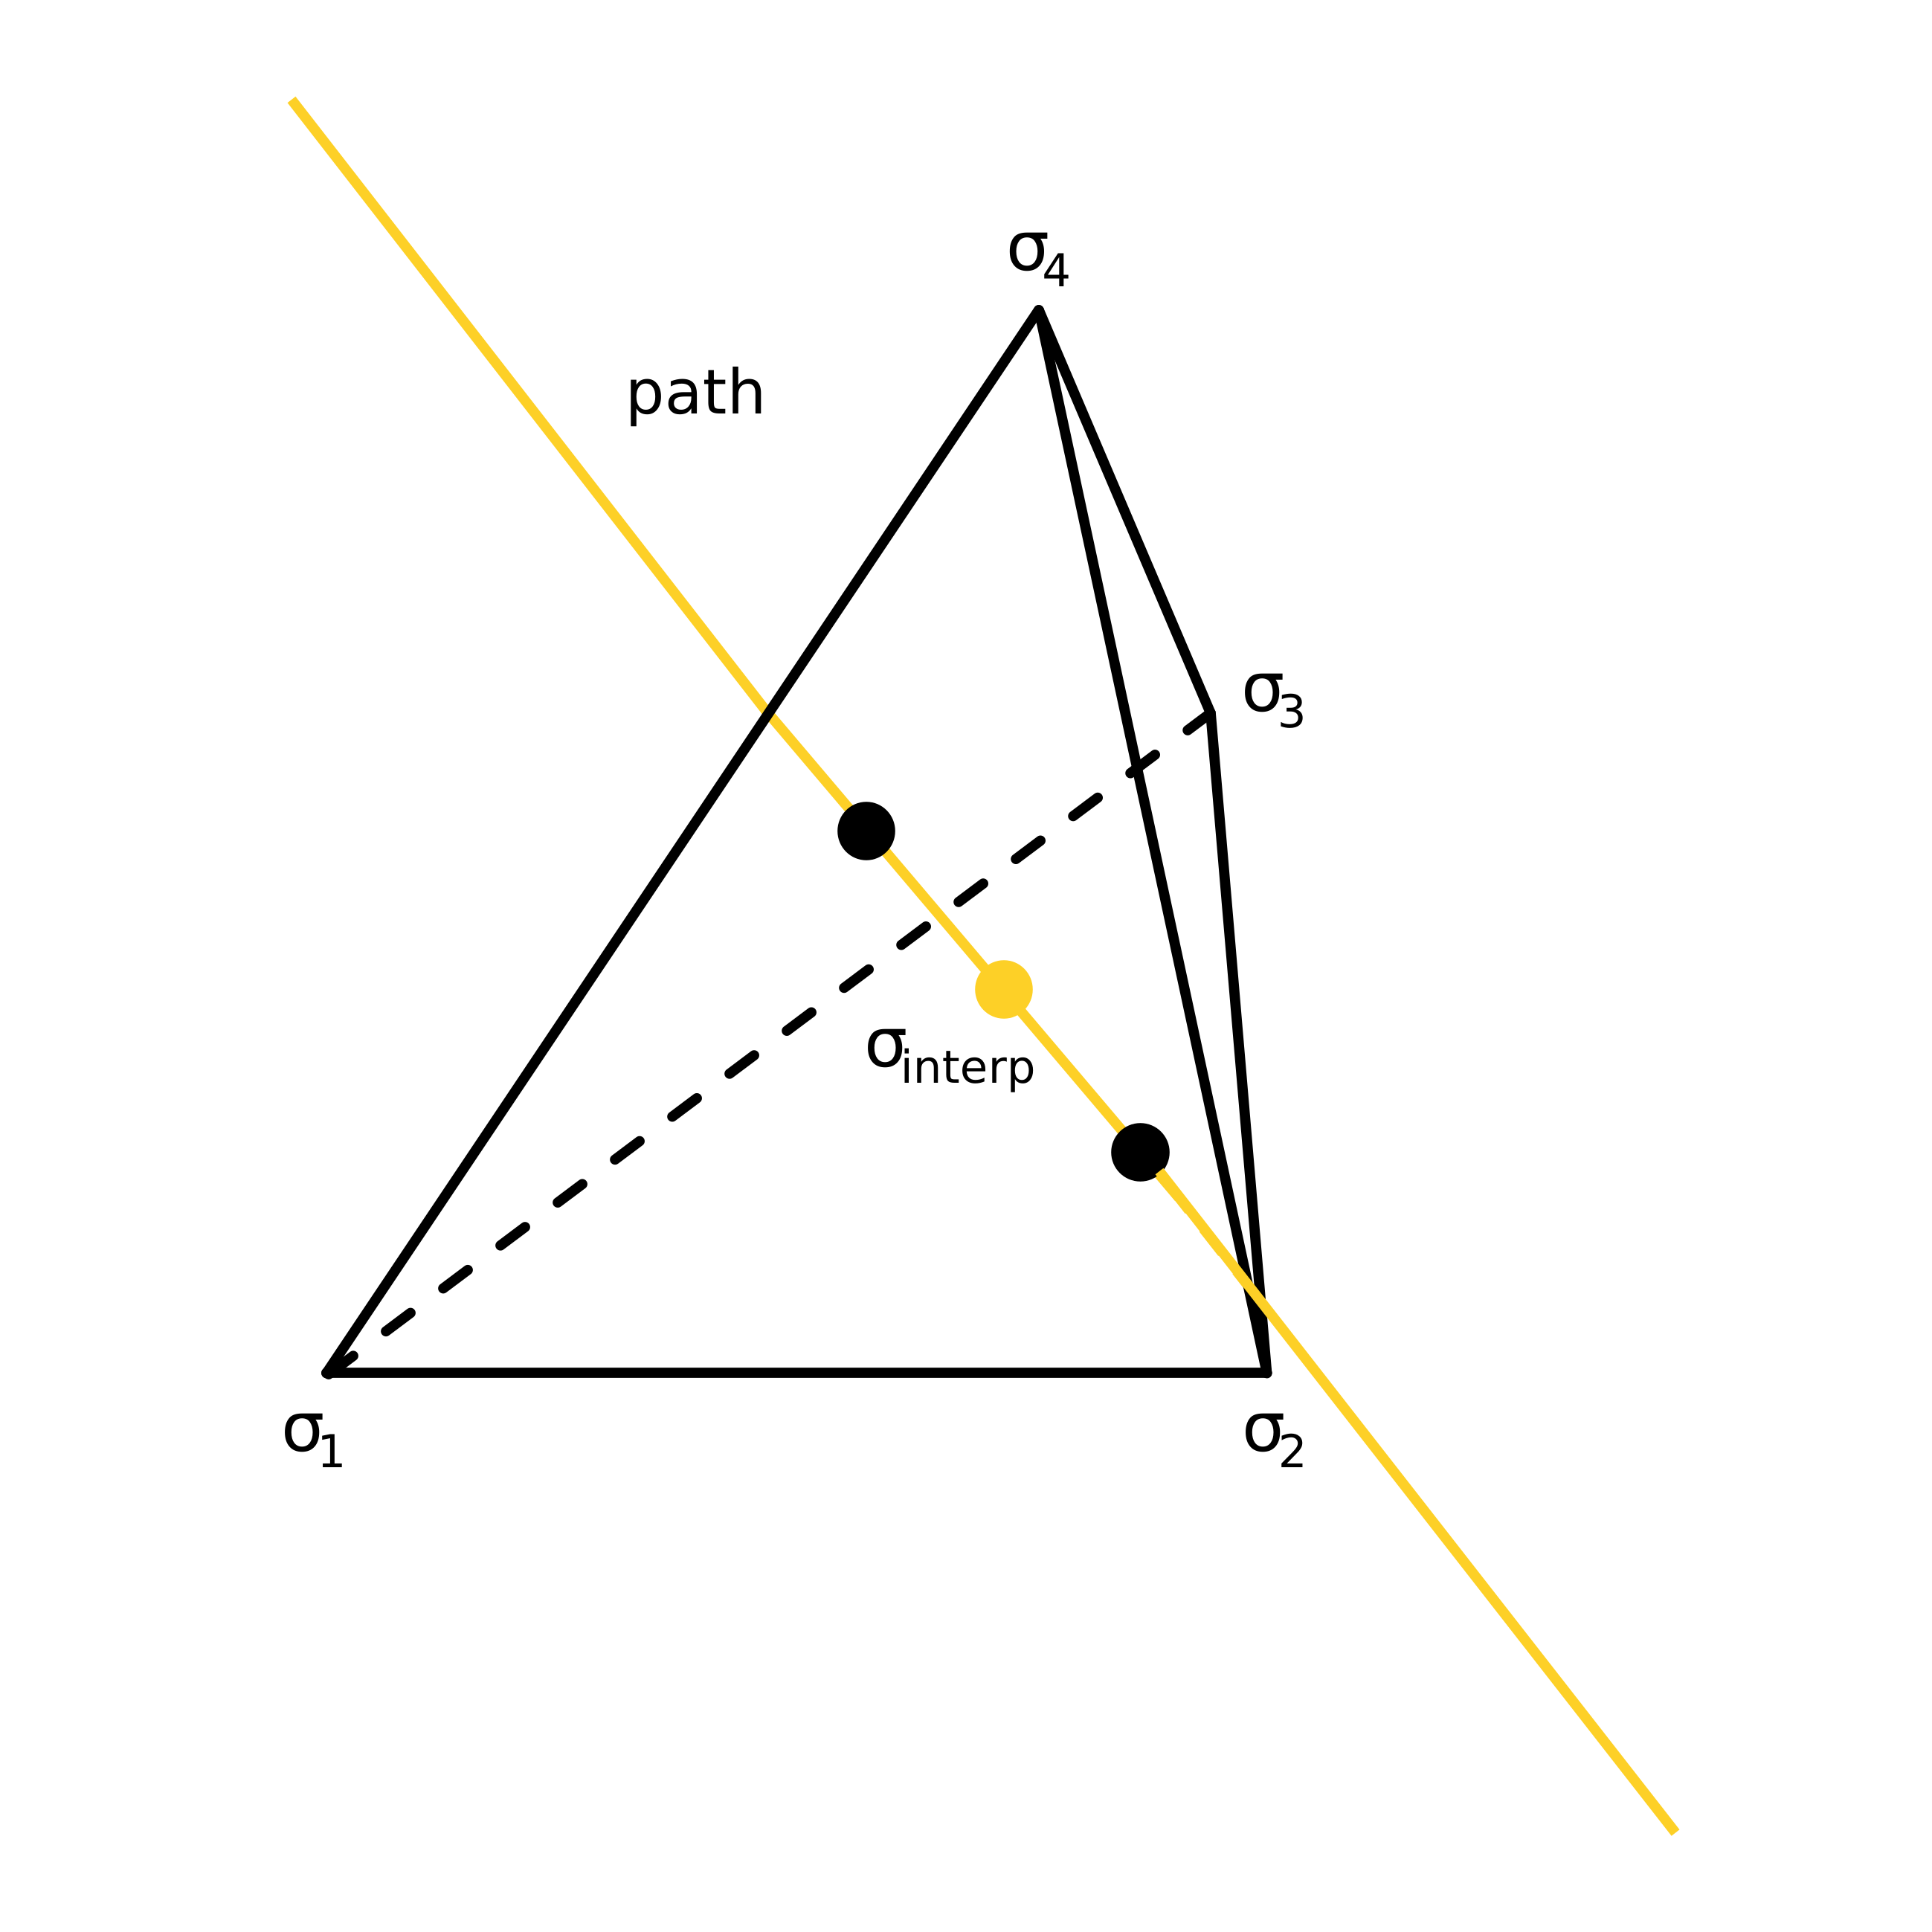
This step computes values along the SCL using interpolation and iterative refinement.
Stress components: X, Y, Z, XY, XZ, YZ
Principal stresses: 1, 2, 3, INT, EQV
Note: As a result, derived quantities such as principal and equivalent stresses may exhibit a non-linear through-thickness distribution, and their maximum may occur at a location other than the source or target surface.
Linearization is a process that approximates a general distribution using a linear function. It can be expressed as y = kx + b.
In a normalized case, the coefficient k represents the bending component and the coefficient b represents the membrane component of the quantity.
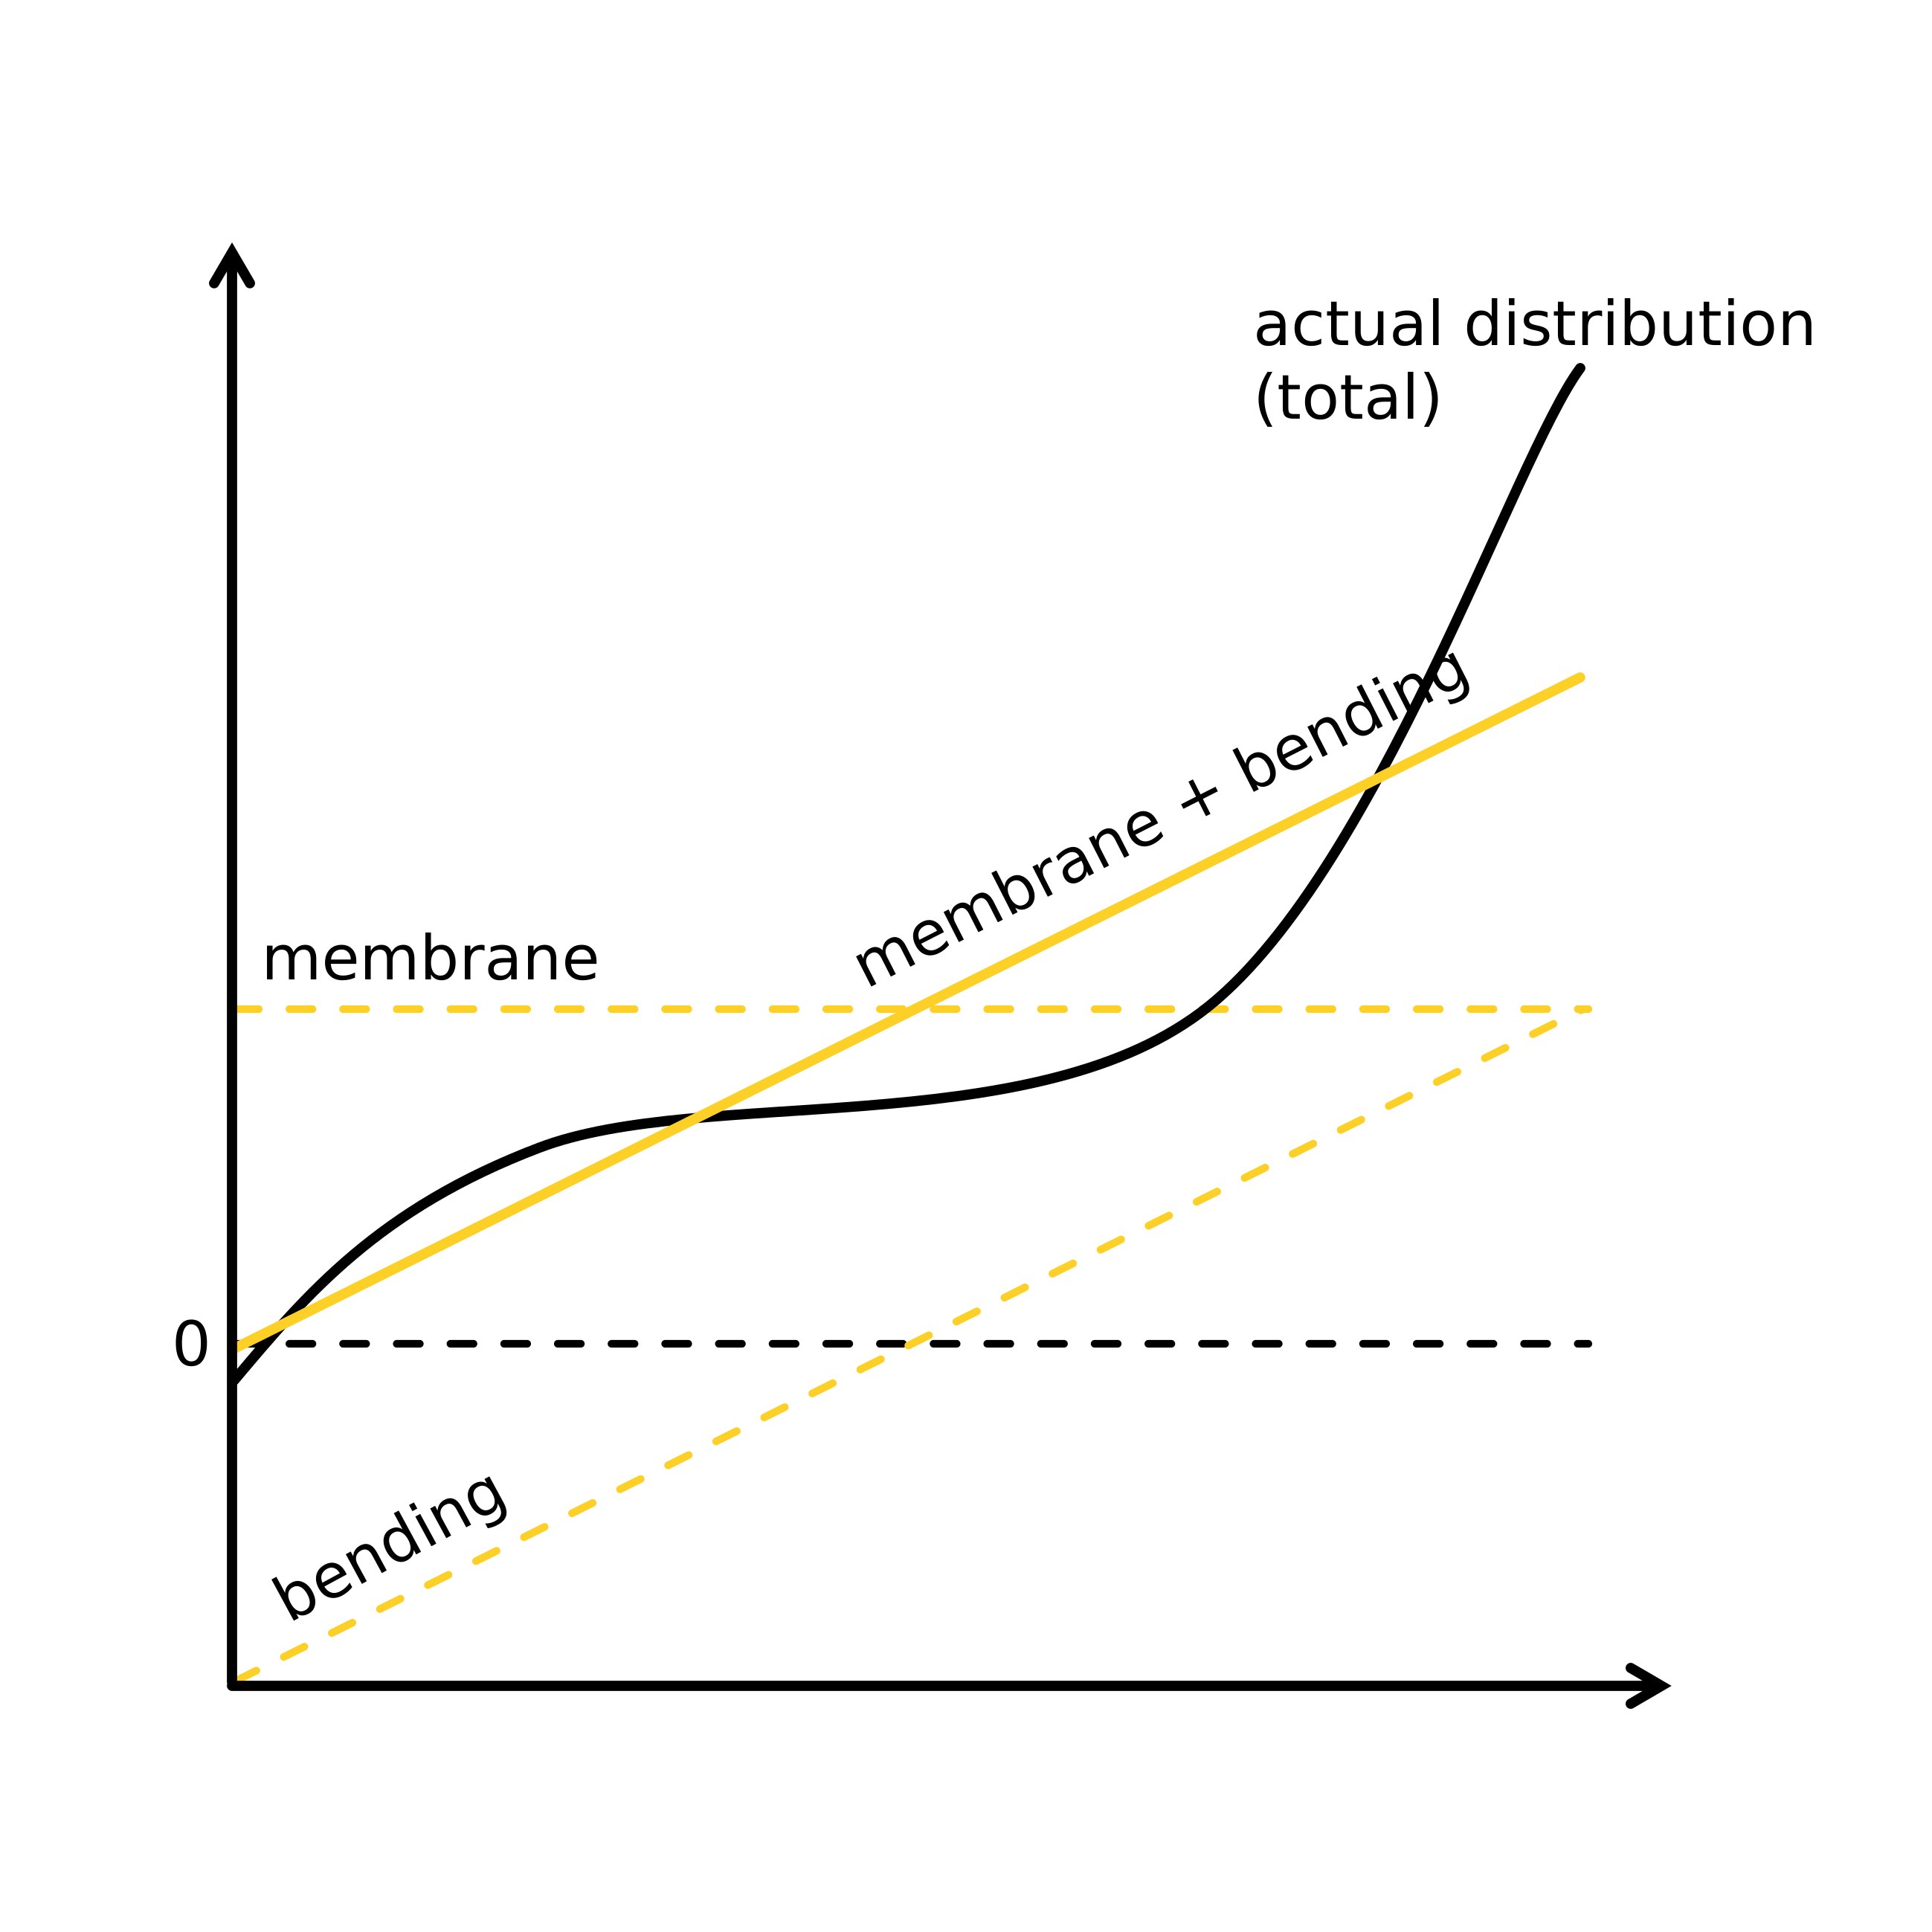
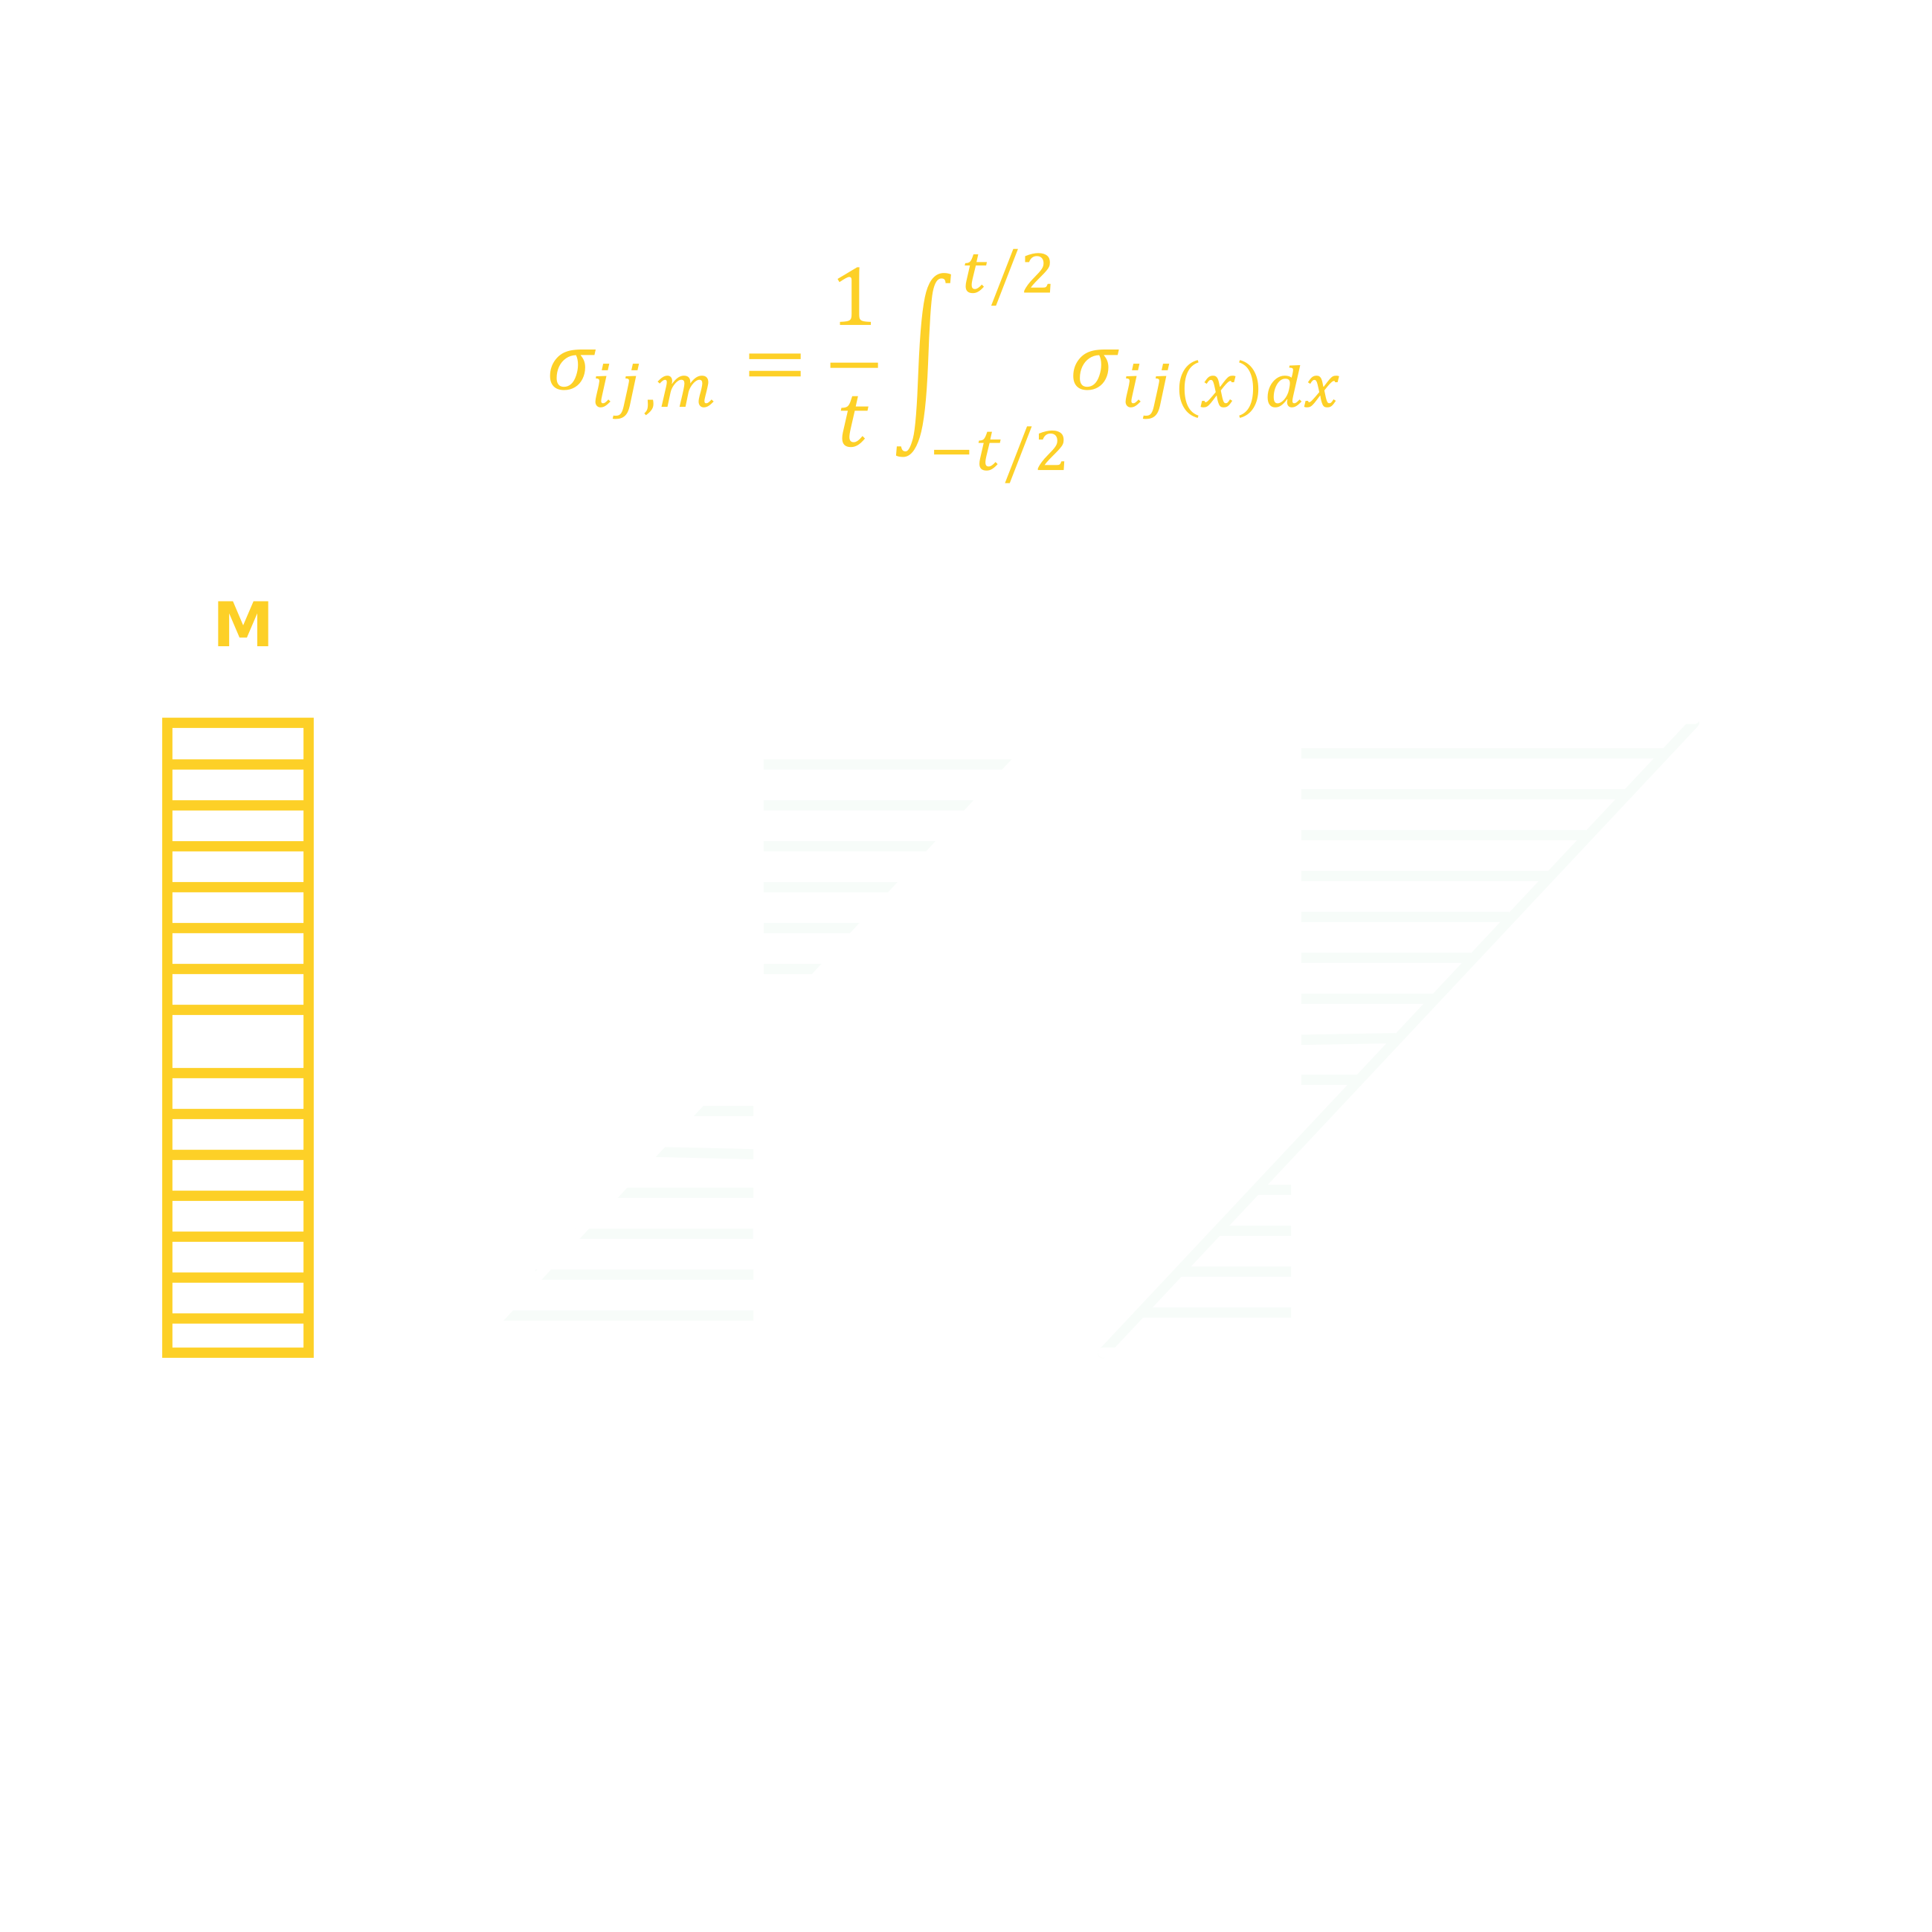
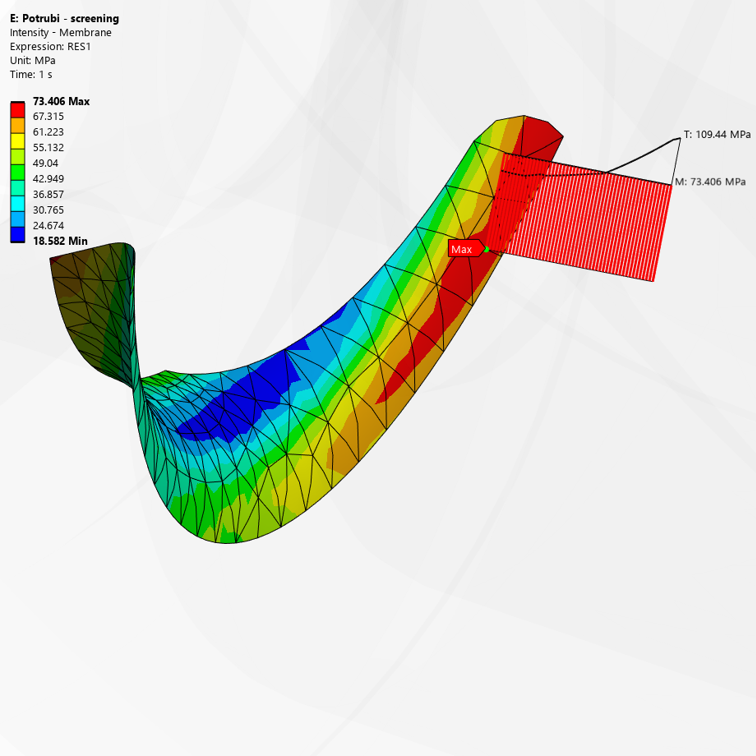
The membrane component represents the average value across the thickness. It is obtained by "redistributing" the total area under the curve into a uniform distribution, resulting in a constant (rectangular) stress profile.
It represents a uniformly distributed tensile or compressive stress acting across the entire cross-section. It is the most important stress component with respect to preventing global plastic collapse of the structure.
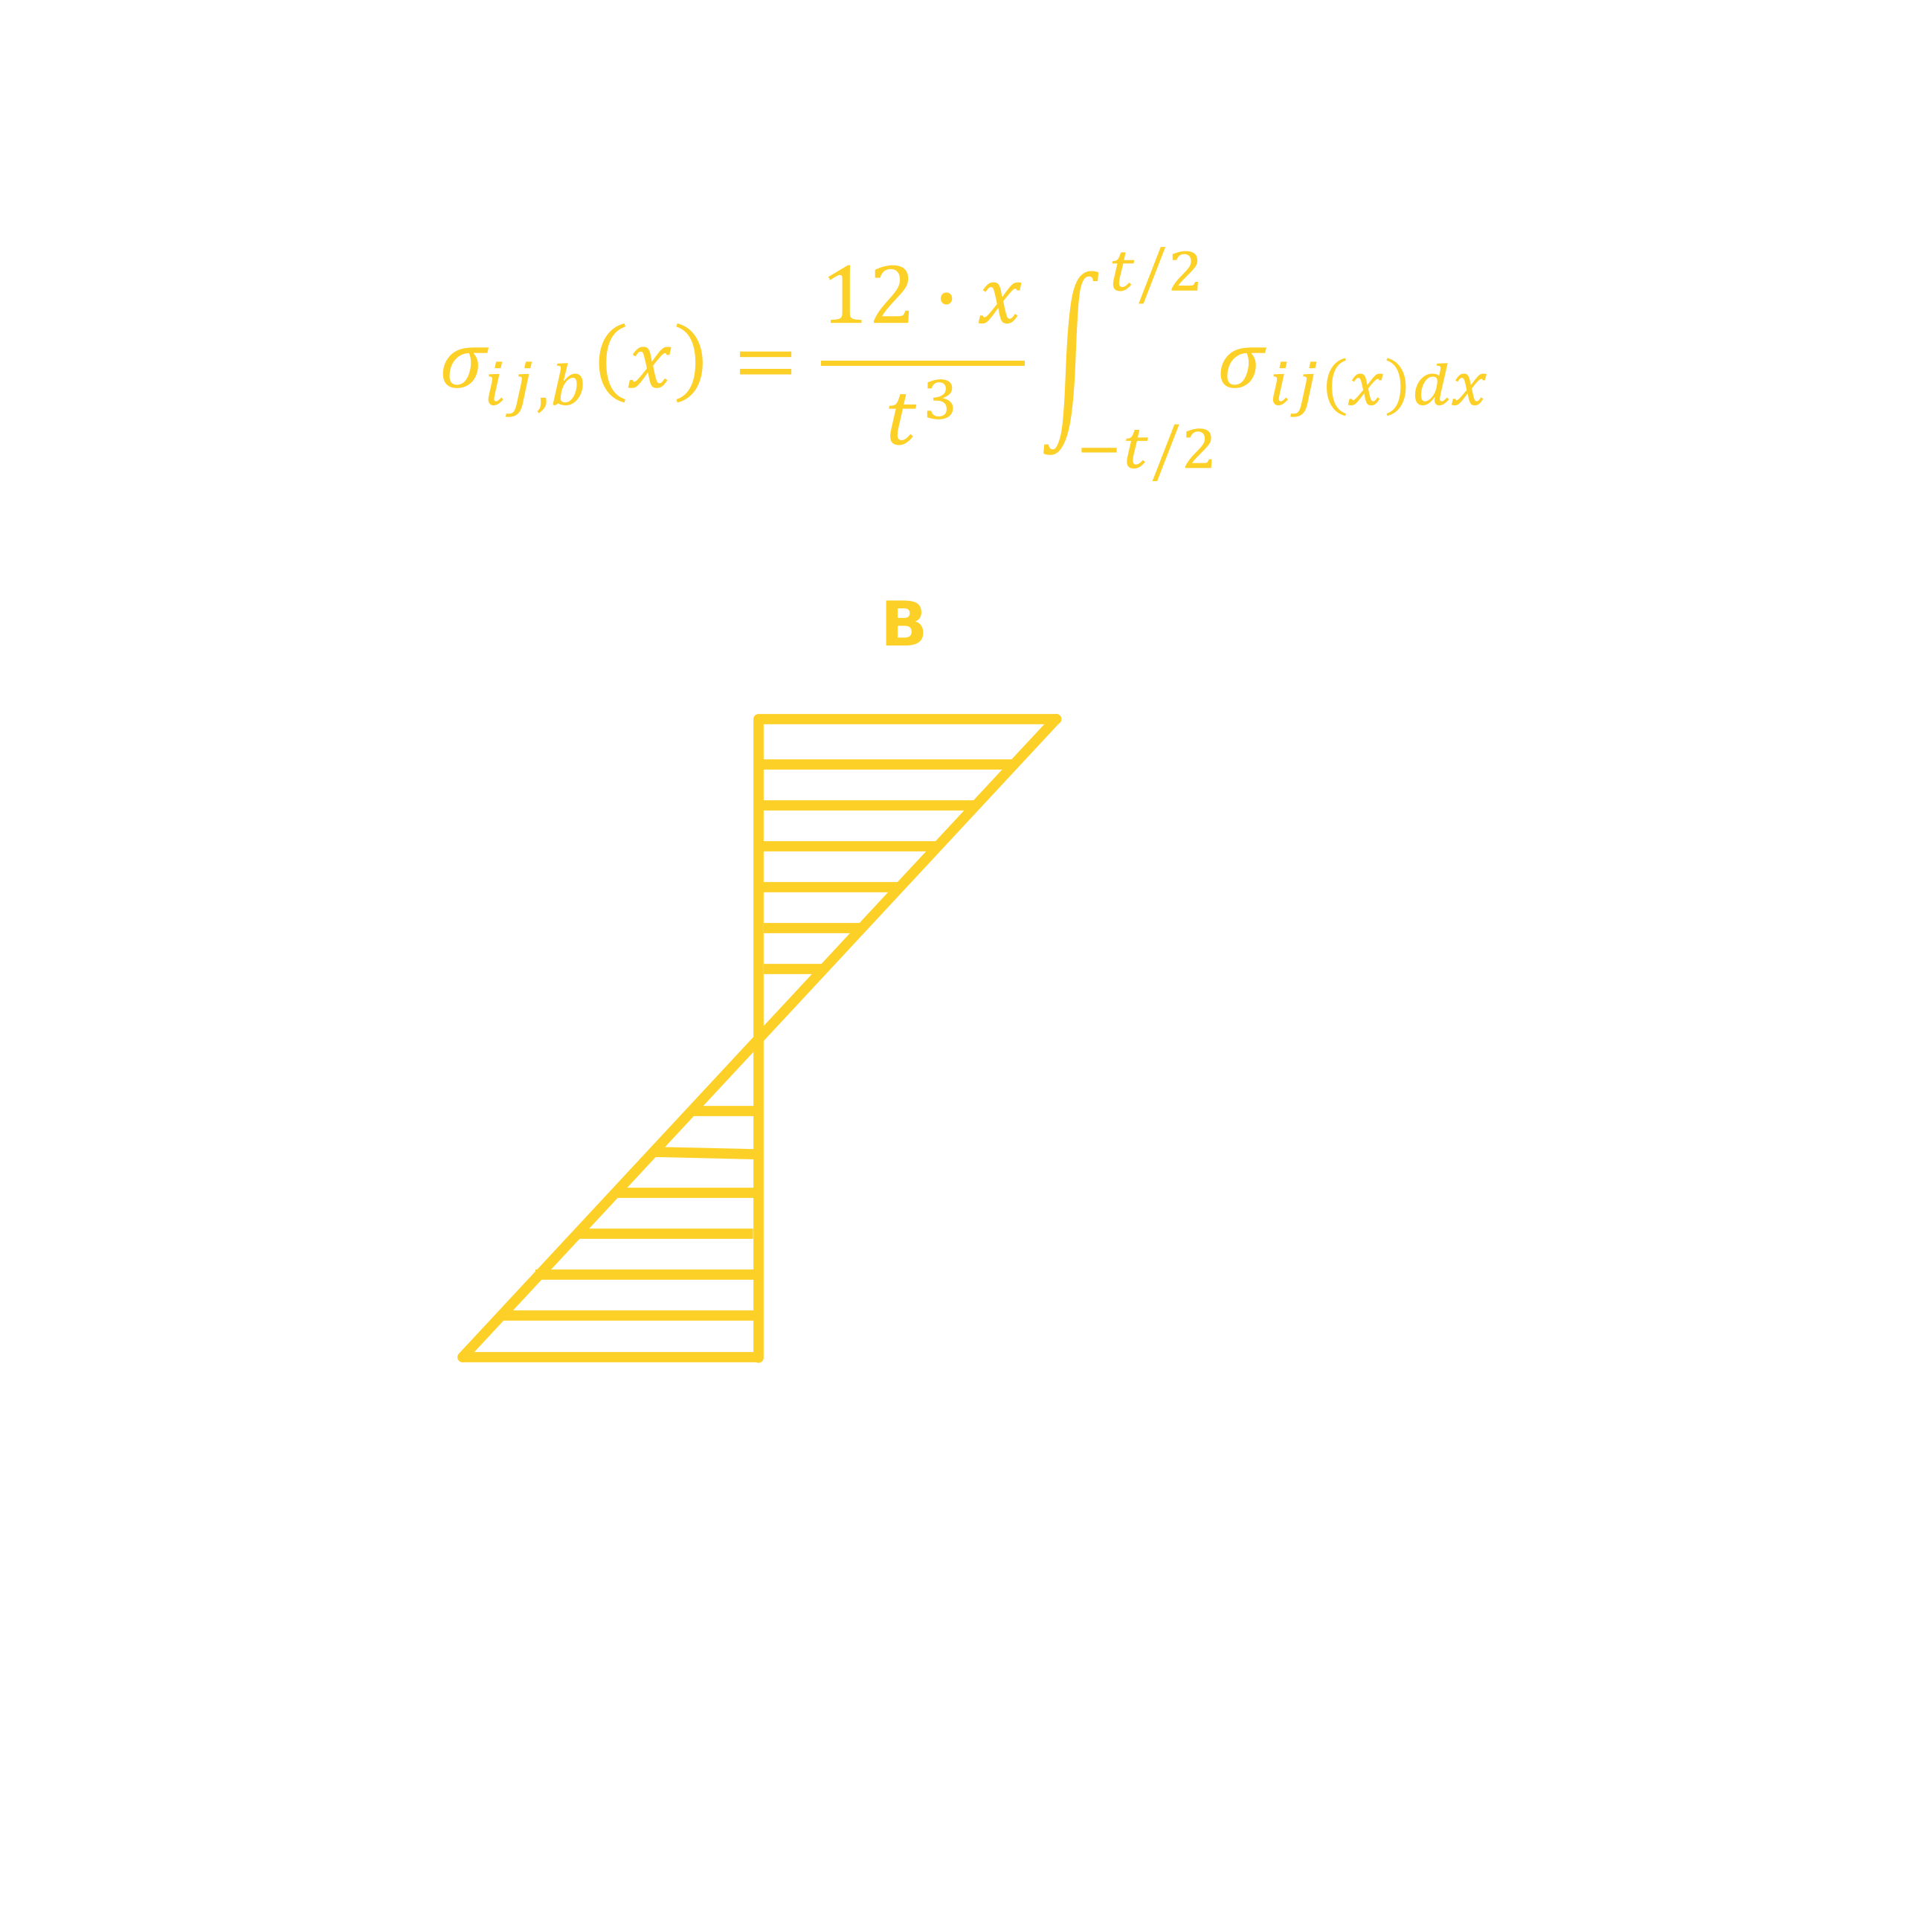
The bending component represents the linear variation of the state across the thickness. It captures how the quantity increases or decreases from the mid-surface, forming a constant gradient (triangular distribution).
It represents the stress distribution that produces the same bending moment as the actual stress field through the thickness. Combined with the membrane stress (Membrane + Bending), it forms the so-called linearized stress distribution.
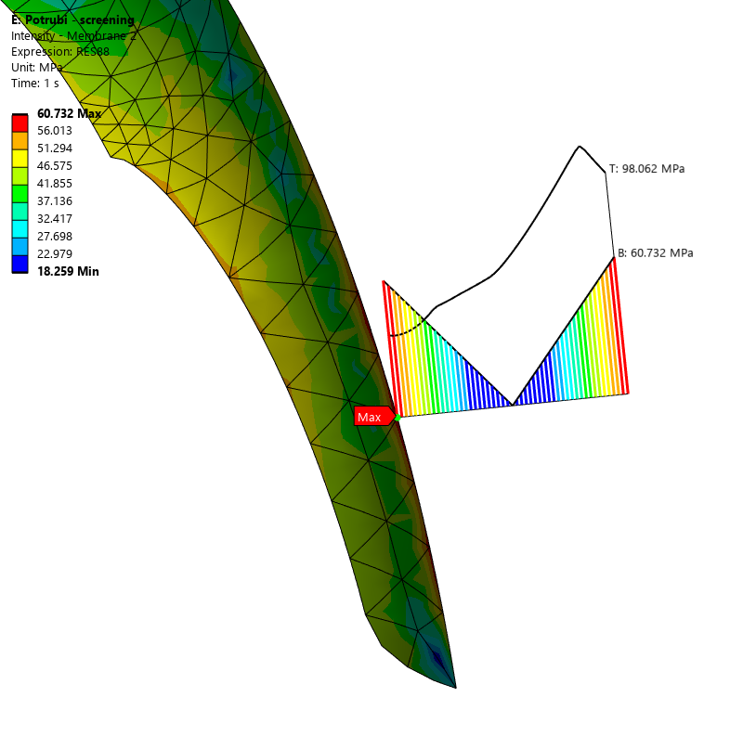
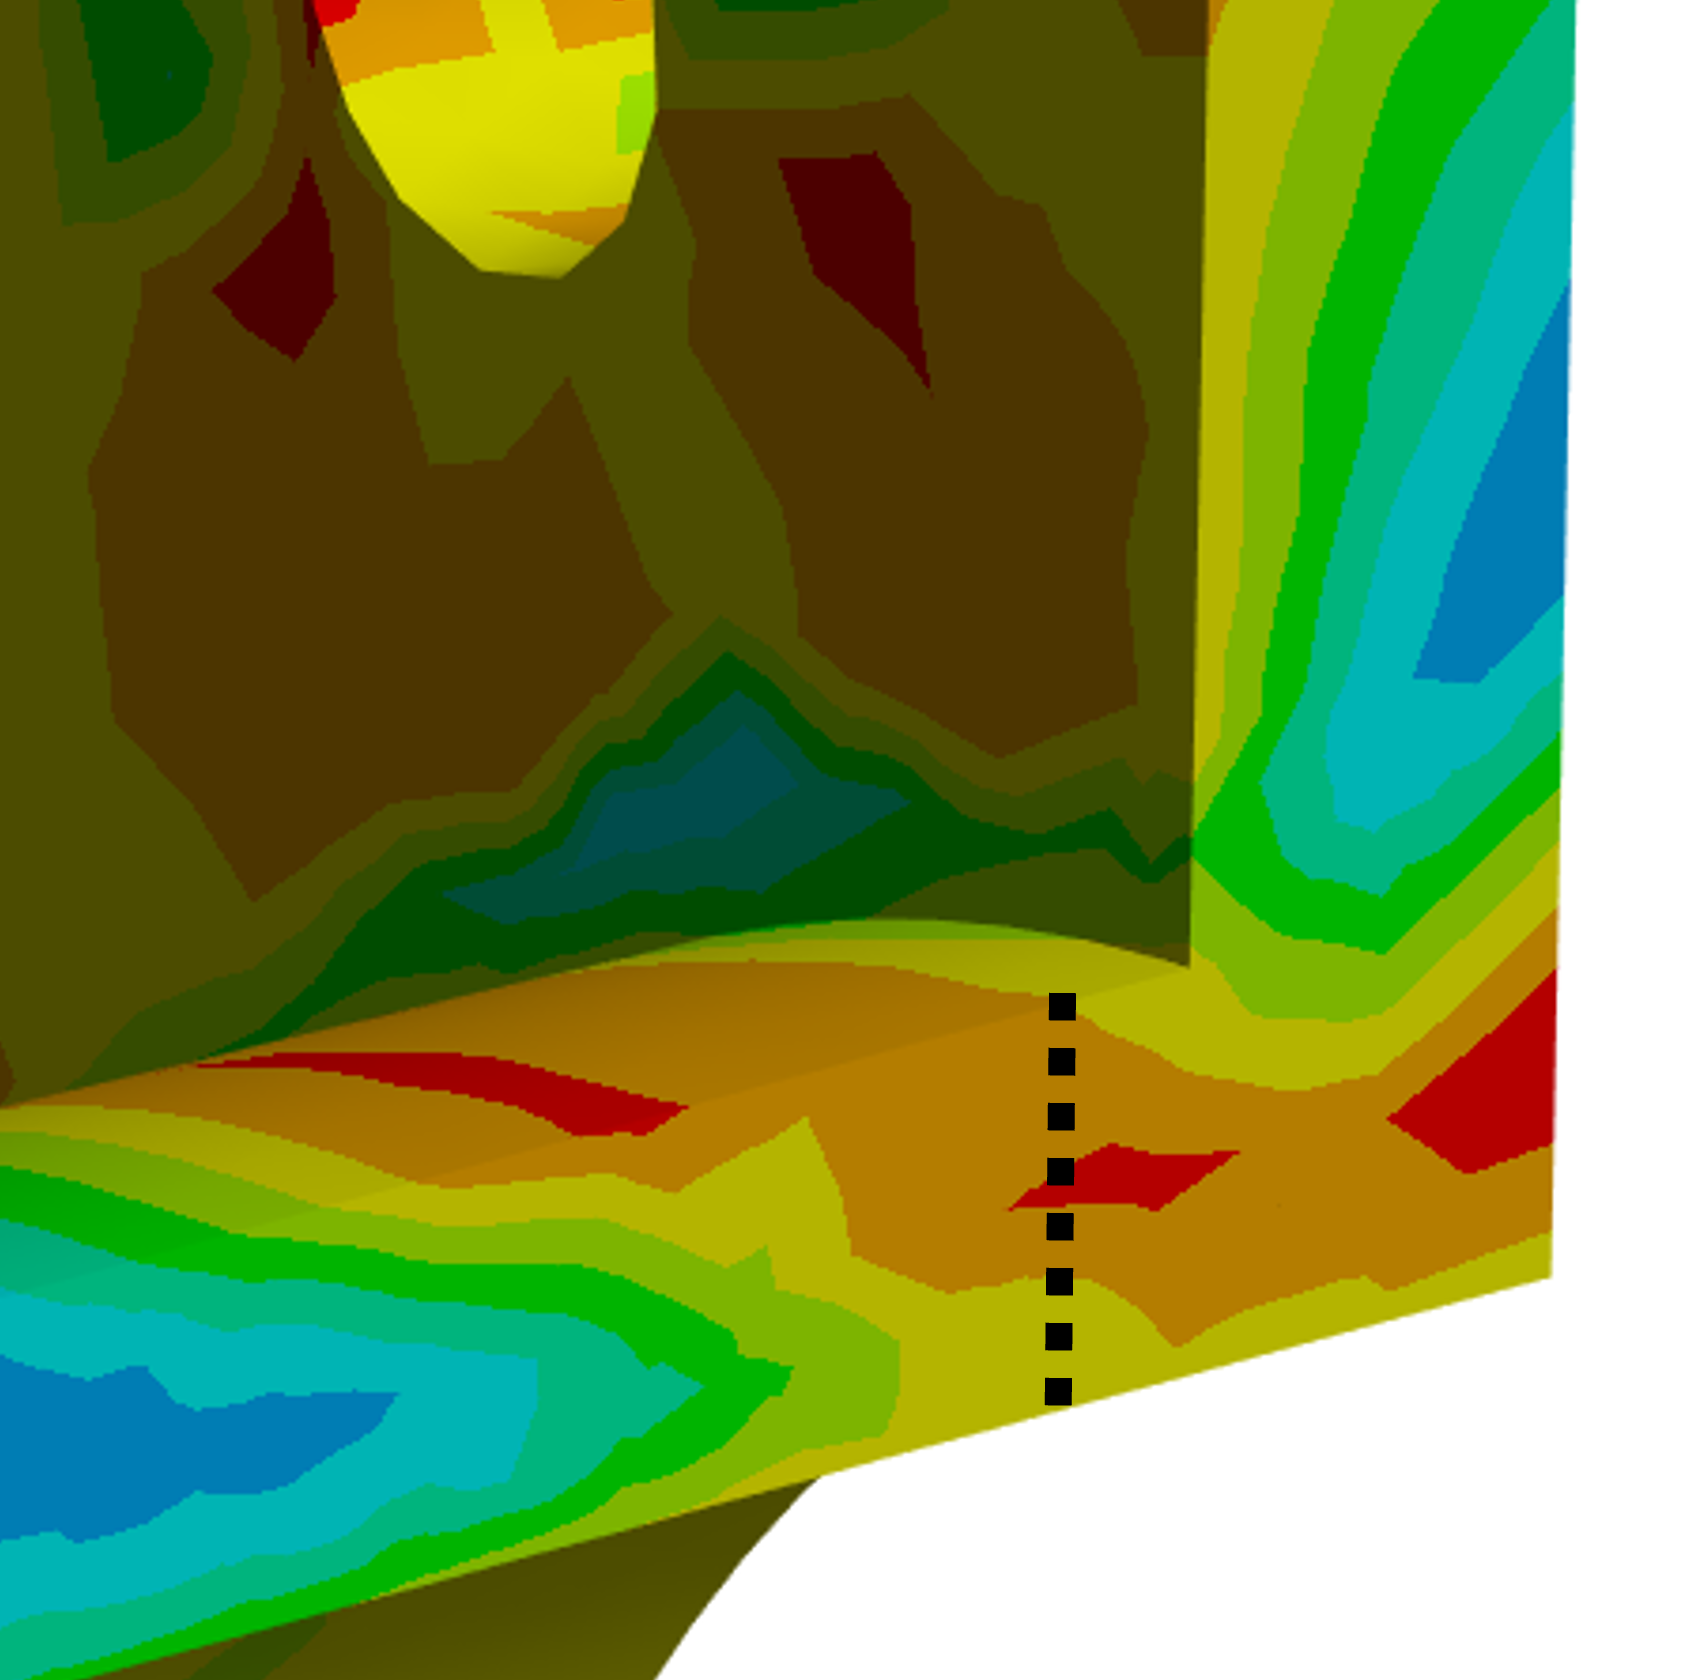
The contour plot allows the stress distribution to be visualized directly on the surface of the geometry.
Only a single value per node is taken from each SCL to build the contour plot:
Results are prepared in the form required by Design by Analysis (DBA) procedures, so they can be used directly for code-based assessment according to:
The linearization itself follows the line-integral method common to these codes, while the classification of the resulting components and the allowable limits remain the responsibility of the assessing engineer.

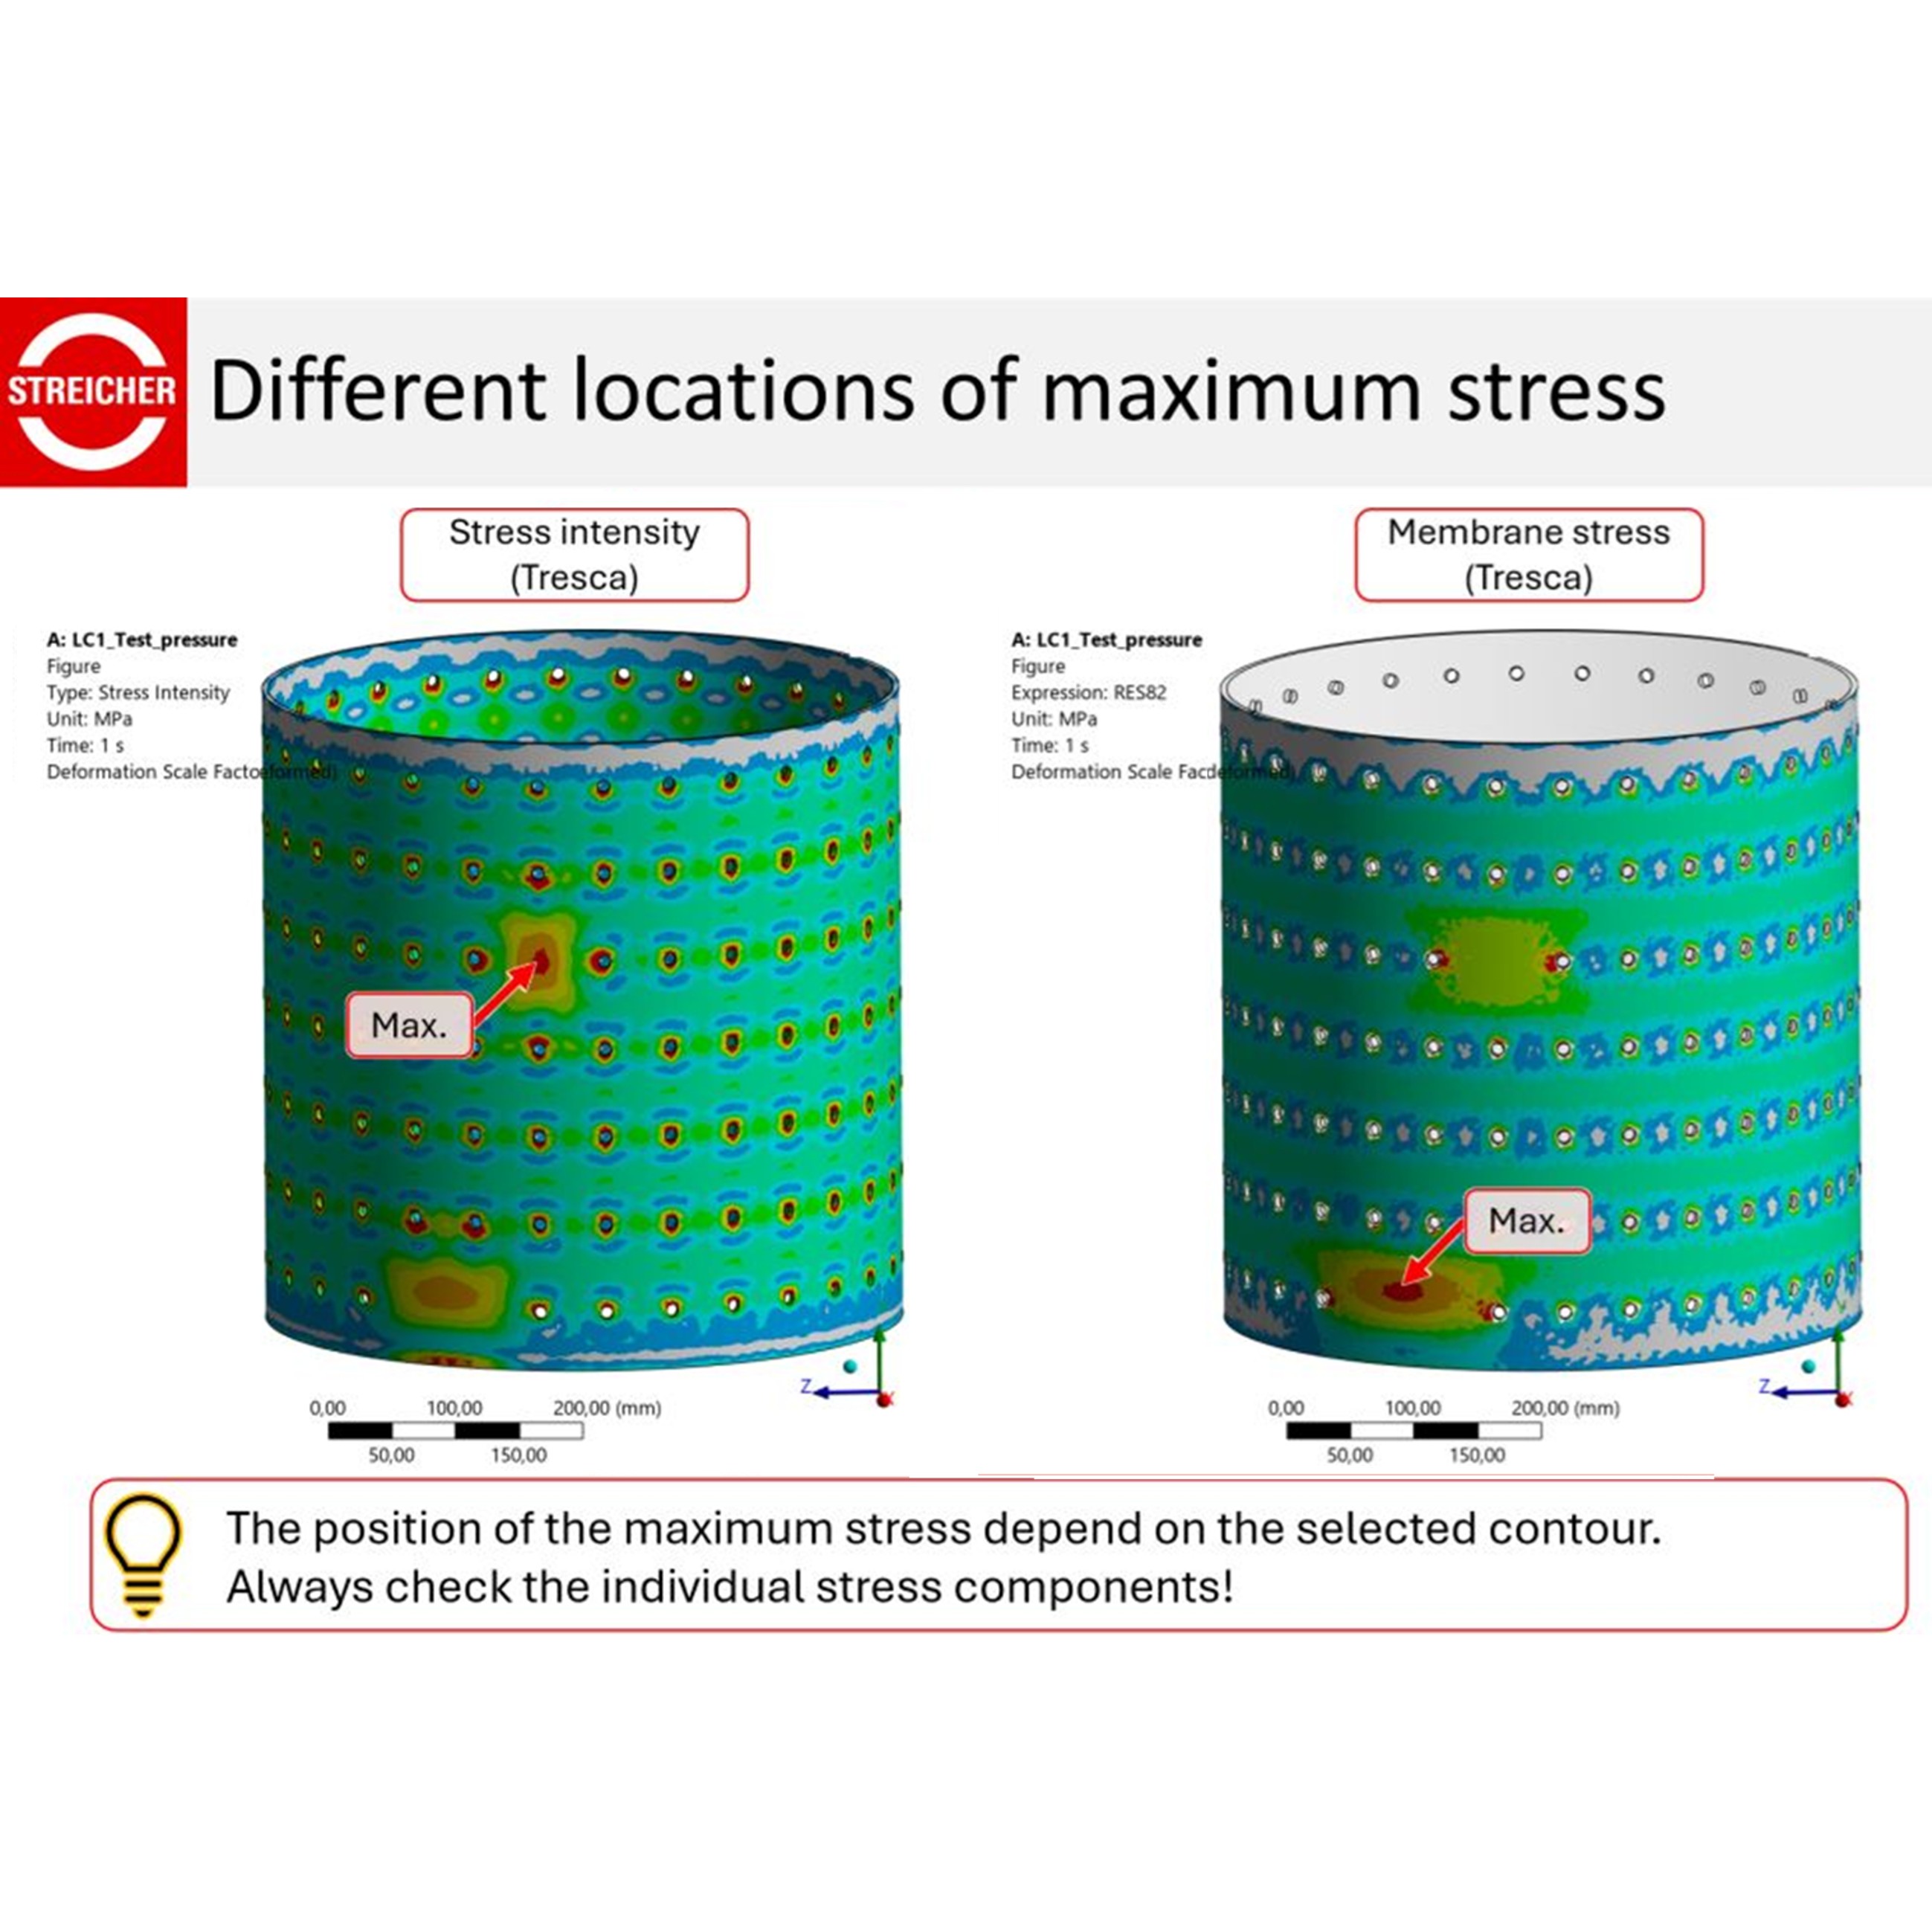
Streicher is an industry leader known for top-tier expertise and quality in construction, engineering, and energy. With decades of experience and modern technology, it reliably delivers complex international projects as a trusted, long-term partner.
Streicher employed the LinSight3D approach to identify critical locations in pressure vessel structures, building on its automated workflow for evaluating results along SCLs.

www.svsfem.cz
SVS FEM s.r.o.
Trnkova 3104/117c
628 00 Brno, Czech Republic

Ing. Zdeněk Čada, Ph.D.
+420 543 254 554
zcada@svsfem.cz